Master Stock Technical Analysis for Beginners-ok
Technical analysis refers to the analysing of the past data of the price movement and forecasting future price movements.
Technical Analysis is a research technique that is used for identifying trading opportunities in the market which depends on market participants’ actions.
The actions of market participants can be analysed by the technical charts, indicators and patterns.
These chart patterns are formed within these technical charts and convey a certain message. Traders need to identify these patterns and make trading decisions.
The trading decisions should include when to enter, exit the trade or where to put stop-loss.
If you are worried about how to do that, then below is a guide that will help you in understanding how to do technical analysis of the stocks:
Technical Analysis for Beginners
First of all, we will understand what trends in technical analysis means:
1. Identifying Uptrend and Downtrend:
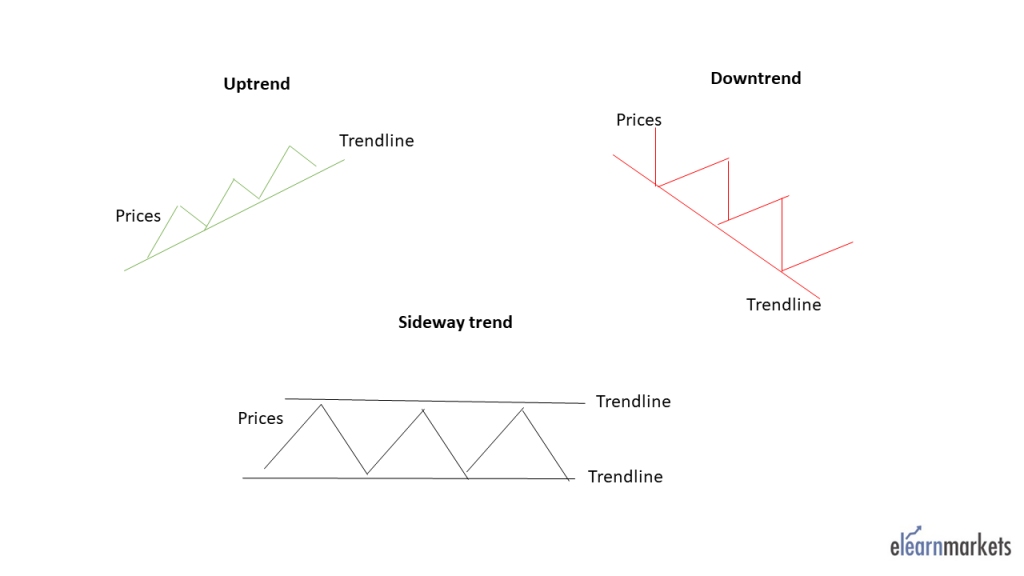
A trend in technical analysis can be defined as the direction of the market which can be of three types: uptrend, downtrend and sideways trend.
If the direction of the prices is upward, then that specific trend is said to be in an uptrend. On the other hand, if prices are moving down then it is in a downtrend.
When the prices are moving or fluctuating between two levels, then the prices of that stock are in a sideways trend.
An uptrend in the charts is characterized by the higher highs and higher lows of the prices.
A downtrend is characterized by the lower highs and lower lows of the prices. A sideways trend can be identified by drawing horizontal lines on the highs and lows of the price movement as shown below:
It is important to identify trends in the stock market as it tells us in what directions the prices are moving.
One should remember that profits in the stock market can be earned by trading with the trend. Novice traders should always try to trade along with the trend as it minimizes the risk
2. Identifying Support and Resistance Levels:
It is important to identify levels of support and resistance as they indicate whether the prices are going to reverse or continue.
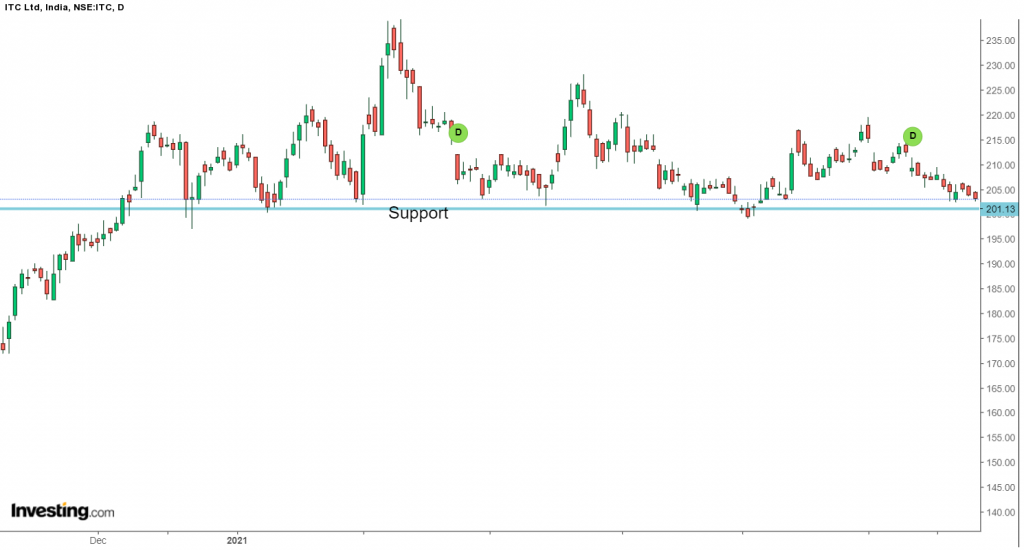
Support is an area where the demand for the stock is more than the supply for the stock, thus, when the prices reach this level, they can reverse to the upside.
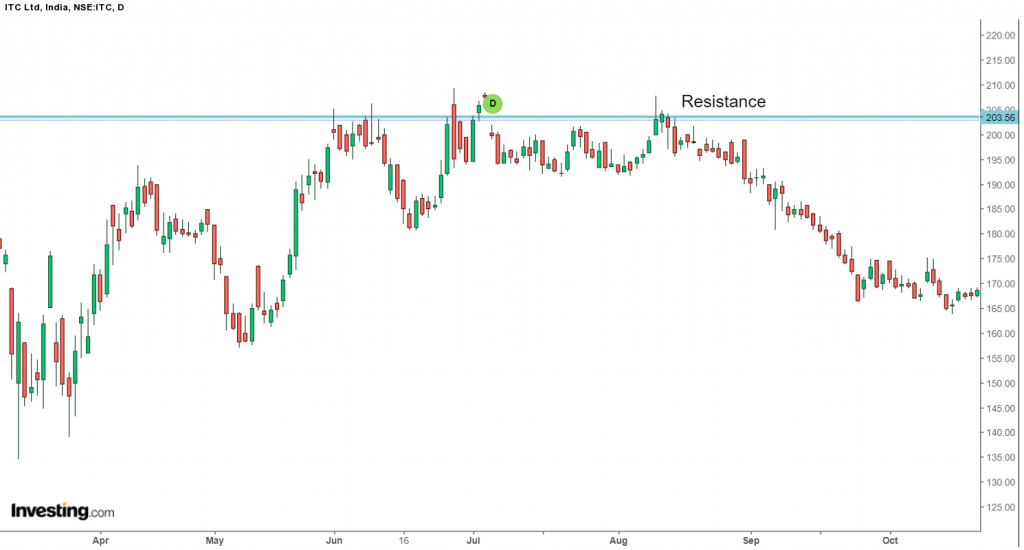
Similarly, Resistance is an area where the supply for the stock is more than the demand for the stock, thus, when the prices reach this level, they can reverse to the downside.
The support level can be identified when the prices reverse from the same level to upside at least more than two times.
The resistance level can be identified when the prices reverse from the same level to the downside at least more than two times.
When the prices break out either from support or resistance, then the prices continue in either of the directions.
3. Price and Volume Analysis:
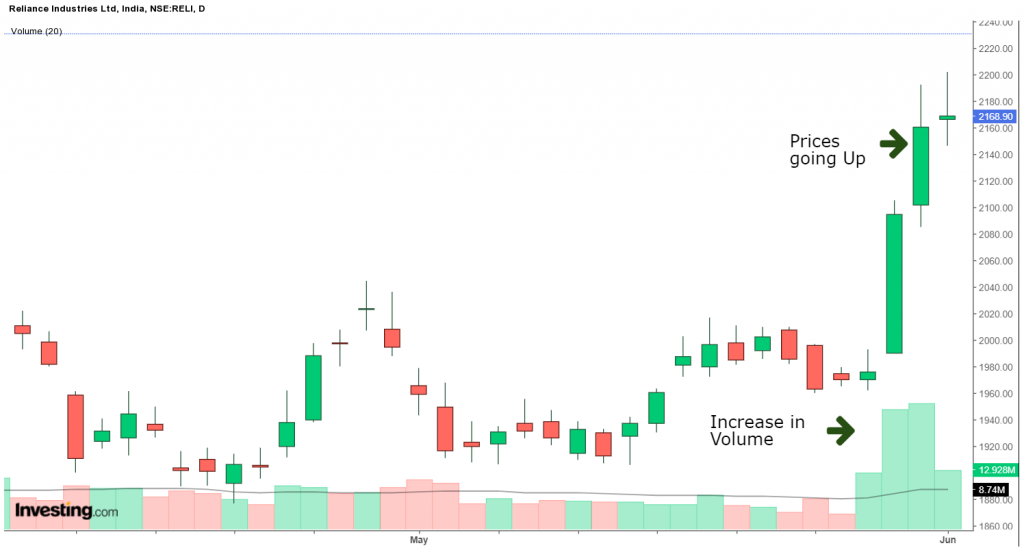
Volume analysis is a crucial technical indicator that every trader should look into as it confirms the ongoing price movement.
An increase in the volume in the ongoing uptrend and downtrend confirms that the trend will continue as shown below:
On the other hand, a decrease in the volume in the ongoing uptrend and downtrend indicates that the ongoing trend will soon reverse.
4. Analysing candlestick charts:
The price actions can be analysed by the candlestick patterns which are formed on the candlestick charts.
Candlestick patterns are a group of candles that indicates whether the current trend is going to continue or reverse.
Advanced Technical Analysis:
We have discussed above the basics of technical analysis which all kinds of traders whether novice or experienced should consider while analysing the technical charts for trading in the stock market.
Below are some of the advanced technical tools which traders should analyse along with the above technical tools.
1. Analysing major technical indicators:
Technical indicators indicate and confirm the signals given by the price actions on the charts.
Technical indicators can be categorised into- trend, momentum, volume and volatility indicators.
Below are some of the popular technical indicators:
A. Moving Averages:
Moving Averages are trend-following indicators that help us in identifying the ongoing trend, i.e., whether the stock is in an uptrend or downtrend.
Moving Averages are simply averages of the specific period, say 10, 20, 50, 100 or 200.
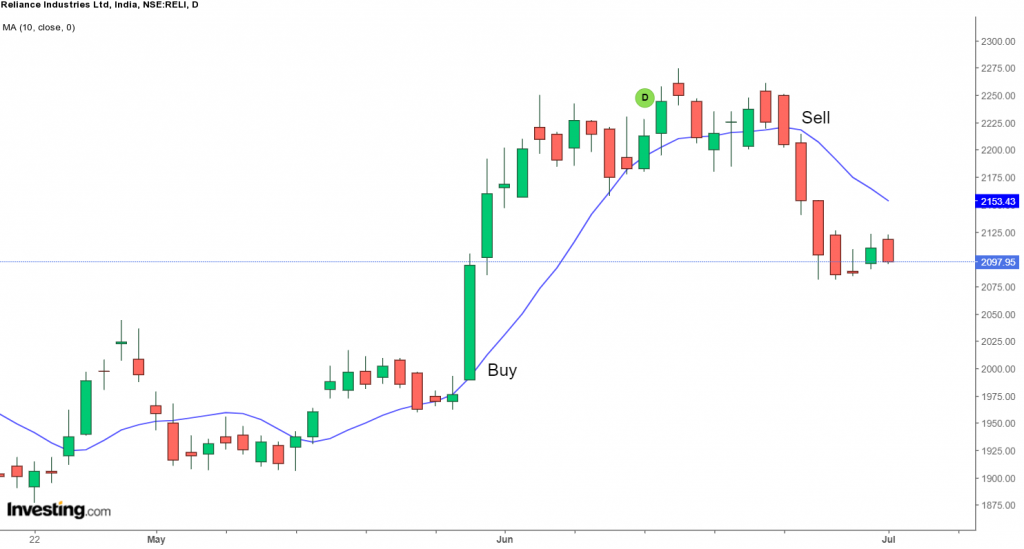
This indicator generates signals when the moving averages cross-price from above or below.
When the moving average crosses price from below then it generates a buy signal and when It crosses the prices from above then it generates a sell signal as shown below:
As it is a trend following indicator, one should use them in the trending market as in the range bound market, this indicator may give false signals.
B. Super Trend indicator:
Super Trend indicator mainly indicates the current direction of the price movement in a market which is trending either upwards or downwards.
This indicator is plotted in stock price charts for traders to analyse the current trend which is shown in red when prices fall and green when prices rise as shown below.
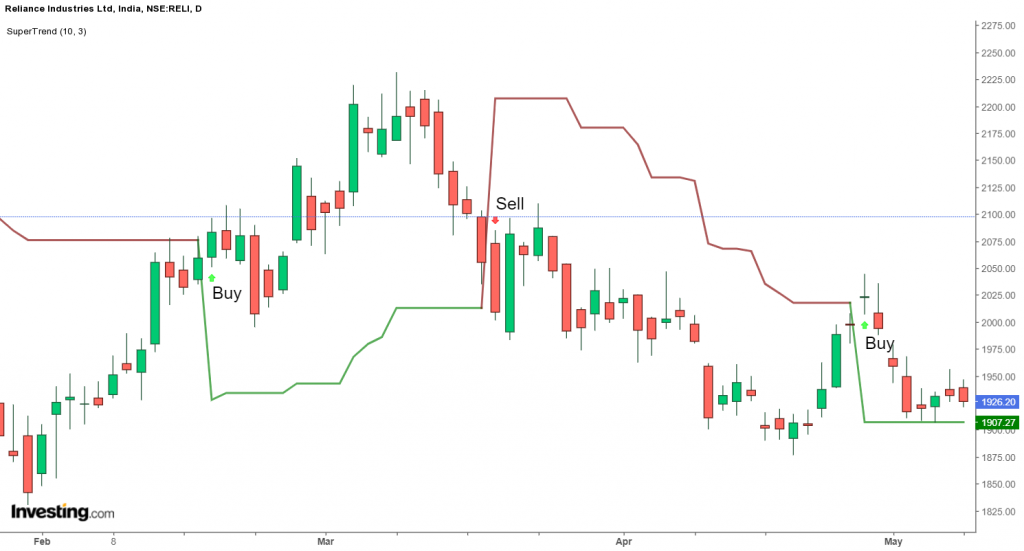
Traders can take trading decisions when this indicator reverses from uptrend to downtrend or vice versa.
C. Relative Strength Index:
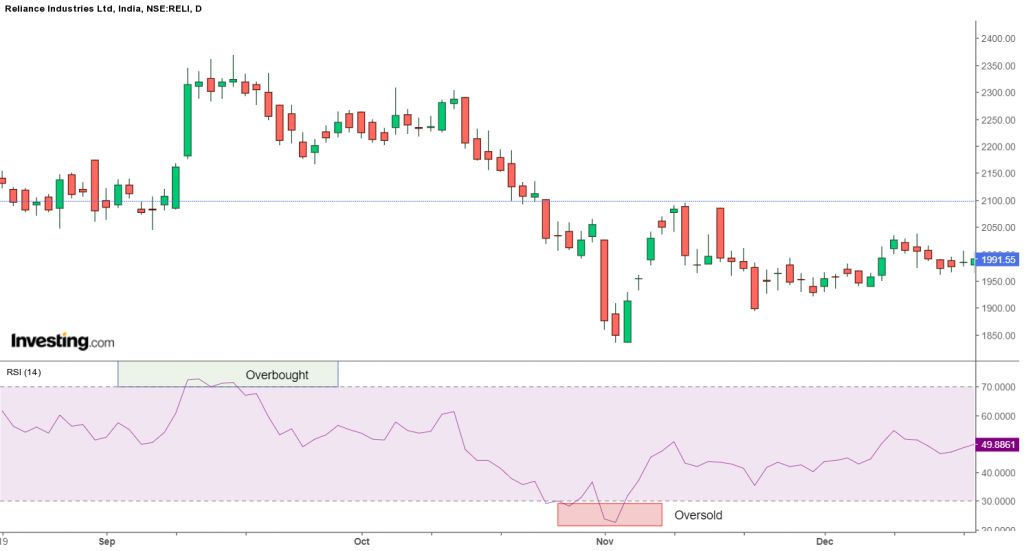
The relative strength index (RSI) is a momentum indicator that measures the magnitude of a recent price change.
This indicator helps in evaluating the overbought or oversold conditions in the price of a stock.
RSI moves between the range of 0 and 100, when this indicator is above 70 then it indicates that the stock may reverse to the downside.
On the other hand, when the stock is below 30, it indicates that the stock may reverse to the upside as shown below:
D. Bollinger Bands:
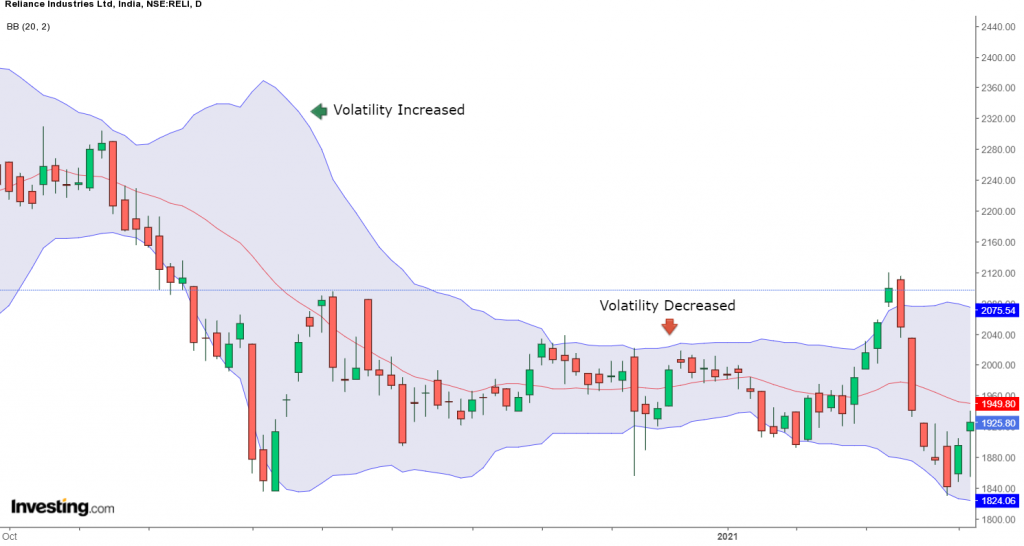
Bollinger Bands is a volatility indicator that indicates volatility in the stock.It consists of three bands, the lower band, the middle band and the upper band.
The middle band is the 20 period Simple Moving Average and the upper and lower bands are plus two and minus standard deviation of the middle band.
When the Bollinger band widens it shows that the volatility in the market has increased and when it contracts it shows that the volatility has decreased as shown below:
2. Identifying Trend Reversal through Candlesticks Patterns
As we have discussed above, the candlestick patterns help in identifying trend reversal. The candlesticks patterns can be divided into bullish and bearish reversal patterns:
A. Bullish candlestick patterns:
The Bullish candlestick patterns are formed after a downtrend and indicate reversal to the uptrend.
The prior trend should be the downtrend when these candlesticks are formed. It can be made up of single or multiple candlesticks.
Some of the examples of Bullish candlestick patterns are Bullish Engulfing, Bullish Harami, Hammer, Inverted Hammer, Morning Star etc.
B. Bearish candlestick patterns:
The Bearish candlestick patterns are formed after an uptrend and indicate reversal to the downtrend.
The prior trend should be the uptrend when these candlesticks are formed. It can be made up of single or multiple candlesticks.
Some of the examples of Bearish candlestick patterns are Bearish Engulfing, Bearish Harami, shooting star, Hanging Man, Evening Star etc.


