20 technical indicators you can trust while stock trading in 2021
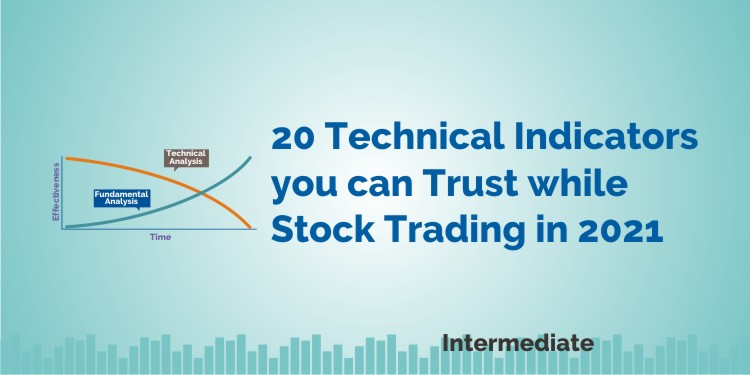
Technical indicators are technical tools that help in analyzing the movement in the stock prices whether the ongoing trend is going to continue or reverse. It helps the traders to make entry and exit decisions of a particular stock.
Technical indicators can be leading or lagging indicators. They can be also based on other parameters like volume, momentum, volatility, and trend indicators.
StockEdge application helps in filtering the stocks based on these technical indicators.
Traders can easily filter stocks using the technical indicators scans available in StockEdge.
Below we have discussed 20 Technical Indicators that can be used by a trader:
1. Moving Averages:
Moving Averages are lagging technical indicators which are used to identify the ongoing trend. The most popular moving average periods are 10, 20, 50, 100, and 200 moving averages.
Moving Average can be Simple Moving Average (SMA), Exponential Moving Average (EMA), and Weighted Moving Average (WMA).
When the prices move above the Moving Average then the ongoing trend is considered to be an uptrend whereas when the prices move below the Moving Average then the ongoing trend is considered to be the downtrend.
2. Moving Average Convergence and Divergence (MACD):
Moving Average Convergence and Divergence (MACD) is another trend identifying indicator which tells us whether the trend is going to continue or reverse.
It consists of two lines, the MACD line and the Signal line.
The MACD line is calculated by subtracting the 26 periods EMA from 12 periods EMA. The signal line is 9 periods EMA.
When the MACD crosses the signal line from below, it gives a buy signal and when it crosses the signal line from above it gives a sell signal.
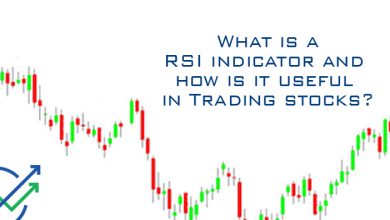
3. Relative Strength Indicator (RSI):
Relative Strength Indicator is a momentum oscillator which measures the magnitude of change in the recent prices. It has a reading from 0 to 100.
It tells the trader whether the prices are in the overbought or oversold region. Above 70 it is considered to be an overbought zone and below 30 it is considered to be an oversold zone.
The default period is 14 periods but the trader can change according to his trading setup.
Learn from Market Experts
4. Channel Commodity Index (CCI):
Channel Commodity Index (CCI) is one of the technical indicators which measures the difference between the current prices and historical prices.
It has a reading of 100 to -100. When CCI moves from the negative to near 100 then the prices are considered to be bullish.
On the other hand when CCI moves from the positive to near -100 then the prices are considered to be bearish.
5. Stochastic Indicator:
Stochastic Oscillator is a momentum oscillator which looks at the most recent closing prices as a percentage of the price range.
It oscillates between 0-100 values where above 70 is considered to be an overbought zone and below 30 is considered to be the oversold zone.
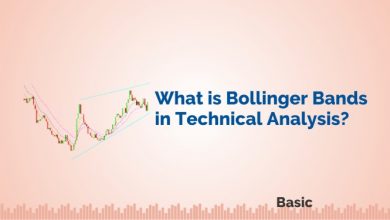
6. Bollinger Bands:
Bollinger Bands is a volatility indicator which considers of 3 bands, in which the first and third band is +2 and -2 standard deviation and the middle band is the 20 days simple moving average.
When the volatility in the stock increases then the bands expand when the volatility in the stock reduced the bands contract.
7. Super Trend:
A Super Trend is a trend following indicator which is plotted on price.
It is constructed with just two parameters- period and multiplier. The default parameters are 10 Average True Range (ATR) and 3 for its multiplier
When the dots are above the prices then the trend is considered to be bearish when the dots are below the prices then the trend is considered to be bullish.
8. William %R:
Willian %R is a momentum oscillator that acts the same as the stochastic indicator.
It oscillates between 0-100 values where above 70 is considered to be an overbought zone and below 30 is considered to be the oversold zone.
9. Volume:
Volume refers to the number of shares traded in a particular stock. It is a useful indicator as it helps in confirming the price actions.
When the volume increases with the price then the ongoing trend is confirmed and when it decreases with the increase in price then its shows weakness in the ongoing trend.
10. Price Volume Trend:
The volume price trend indicator is used for determining the balance between a stock’s demand and supply.
The change in percentage of the share price trend represents the relative supply or demand of a particular stock, whereas volume indicates the force that is behind the trend.
This indicator is similar to the on-balance volume (OBV) indicator whichmeasures cumulative volume.
11. Donchain:
Like Bollinger Bands Donchian indicator also consists of three bands- the mid-band is an average of the upper and lower bands.
The upper band shows the highest price of security whereas the lower band shows the lowest price of a security over a particular period.
Like Bollinger Bands, this indicator also shows the volatility in the stock.
12. Exponential Moving Average (EMA):
Exponential Moving Average (EMA) is a type of Moving Average which gives weights to the recent prices.
Since the recent prices hold more importance about the price movement more weightage should be given to them.
This is the reason why most of the traders use Exponential Moving Average than Simple Moving Average.
13. Open Interest:
Open Interest refers to the number of outstanding derivatives contracts in the market. It is an important indicator to determine whether the ongoing trend will continue or reverse.
When the price increases along with volume and open interest it indicates bullishness in the market.
When the price decreasealong with open interest and volume falling down it indicates that the market is bottoming.
14. VWAP:
The volume weighted average price (VWAP) is used by traders which gives the average price a stock that has traded at throughout the day, depending on both volume and price.
This indicator is important as it tells the traders both the trend and value of a stock.
15. Fibonacci Retracement:
Fibonacci retracement levels are horizontal lines indicatinglevels of support and resistance and are based on Fibonacci numbers.
Each level shows a percentage that tells us how much of a previous move the price has already retraced.
The Fibonacci retracement levels are Fibonacci ratios such as 23.6%, 38.2%, 61.8%, and 78.6%.
16. Average Directional Index:
The average directional index (ADX) is one of the technical indicators that is used by traders for determining the trend’s strength.
The trend can be up or down, which is shown by two indicators, the negative directional indicator (-DI) and the positive directional indicator (+DI).
Thus the ADX indicator consists of three separate lines. This indicator helps the traders to analyze if a trade should be taken long or short, or should be avoided.
17. On Balance Volume Indicator:
On-balance volume (OBV) is one of the technical indicators that uses volume flow for predicting changes in stock price.It shows that change in volume based on the bar to bar price change.
This indicator provides a total of an asset’s trading volume and helps in indicating if the volume is flowing in or out of a particular stock.
The OBV is a total volume both positive and negative. As this is a leading indicator it sometimes may produce false signals.
18. Aroon:
Aroon is one of the technical indicators which determines if the stock is trending or not and also shows the strength of the trend.
It is similar to other momentum oscillators as it helps the traders to take decisions when to make entryor exit.
This indicator consists of the “Aroon up” line, that measures the uptrend strength, and the “Aroon down” line measuring the downtrend strength.
19. Correlation Coefficient:
Traders can calculate the correlation coefficient for finding the correlation between any two parameters whether market indicators or stock which can be tracked numerically.
In statistics, correlation is the version of covariance measuringif the parameters are positively or they are inversely related.
It is a very important concept in technical analysis, as it helps in assessing the mechanics of price patterns.
20. Money Flow Index:
The Money Flow Index is a technical oscillator which uses price and volume to identify overbought or oversold zones.
This indicator can also be used for spotting divergences that warn the change in price. The oscillator oscillates between 0 and 100.
Unlike the Relative Strength Index (RSI), the Money Flow Index includes both price and volume whereas RSI is based just on price. This is the reason why MFI is also known as the volume-weighted RSI.
Should you only rely on technical indicators?
Technical indicators should be used along with the price action on the technical charts, as sometimes it may also give false signals.
Price actions confirm the signals given by the technical indicators. Traders can also use a combination of 2-3 indicators to confirm the signal given by each other.
Bottomline
As discussed above, traders should not use technical indicators solely as they may provide false signals. Traders should develop a trading setup with 2-3 technical indicators and trade accordingly. The decision on which technical indicators to use depends on the trading setup of the trader.
You can also visit web.stockedge.com is a unique platform, which is 100% focused on research and analytics.