RSI Indicator and How is it useful in Trading Stocks?
I start with the disclaimer that the following answer is for academic discussion only and not in the way meant for any specific investment or trading. We request consultation with qualified financial professionals before any trading or investment decisions. This blog is based on RSI indicator and how it is useful in trading stocks.
The author will not be anyway responsible for any financial loss arising from any trading or investment decisions incurred by any individual or entity. We also thank Investing.com as we have used their free charting solutions for our examples.
RSI Formula and Range:
RSI or Relative Strength Index is an oscillator (which moves to and fro within a range, which is 0 to 100 in case of RSI).
This is one of the most used leading indicators (leading, because trading signals are generated before anticipated price movements).
J. Welles Wilder, Jr. introduced the Relative Strength Index, which measures the velocity of price movements of trading instruments (stocks, commodity futures, bonds, forex etc.) over a specified period of time.
The formula for calculating RSI is as follows
RSI = 100 – 100 / (1 + RS)
RS = Average Gain over specified period/ Average loss over the same period
Overbought and oversold region:
RSI upper and lower bound are 100 and 0 respectively and the specified period used is generally 14 days. A user is free to alter the period count to suit his analysis.
A lower period count (like 10) will generate more frequent buy and sell signals (also wrong signals with more frequency) and a higher period count (like 20) will generate a lesser number of buy and sell signals (with a probability of excluding some genuine buy and sell signals generated in 14 periods).
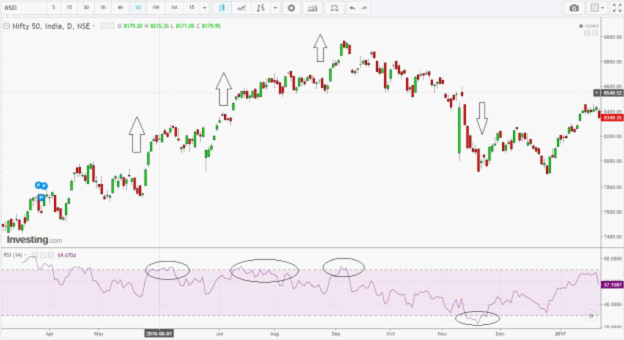
Normally, when a stock or a financial instrument is having its RSI value above 70 it is said to be in an overbought region, while a value below 30 is considered to be in the oversold region as shown in figure 1 below, in Nifty daily chart.
In a more volatile market or a strong bull market, a user can define above 80 levels as overbought level as shown in figure 2, in MCX gold hourly chart.
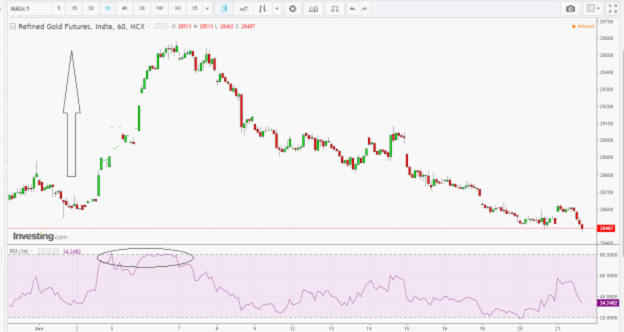
Learn basics of RSI indicator with RSI Made Easy course by Market Experts
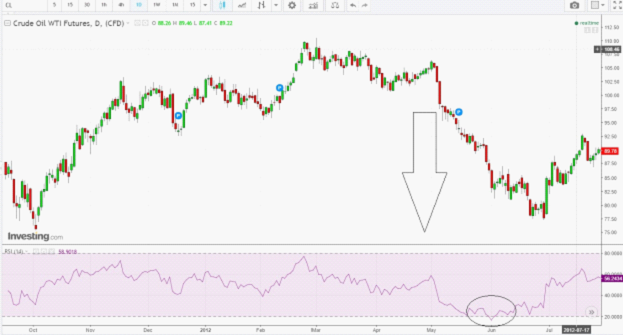
In a similar volatile market and a strong bear market below 20 level as an oversold region. We can see below in figure 3 (a daily chart of WTI crude oil)
Trading signals:
The RSI indicator is used in more than one way to both initiate a fresh position or close a previous open position.
Generally, using them along with some other indicators like Slow stochastic, Bollinger band and price patterns (like candlesticks or classical reversal patterns, flag, wedge, head & shoulder etc. ) give better results than solely depending on the RSI indicator.
Trading overbought and oversold levels of RSI:
When RSI enters ‘30-70’ zone from an overbought region and if there is a simultaneous bearish pattern in the chart, the market usually follows it up with a bearish down move.
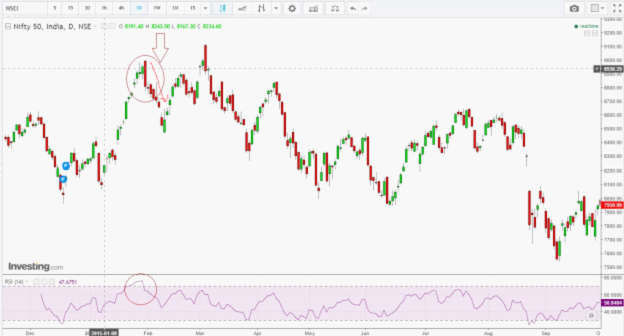
In figure 4, in Nifty 50 daily chart, we see RSI entering ’30-70’ zone, from the overbought region, and a simultaneous bearish engulfing pattern is formed in the chart. This is followed by a tradable down move of 400 points (figure 4).
Similarly, when an instrument enters ‘30-70’ zone, from an oversold region and if there is a simultaneous occurrence of bullish reversal pattern in price chart, we can see a follow-up up move.
Also Read: 5 important roles of Relative Strength Index (RSI)
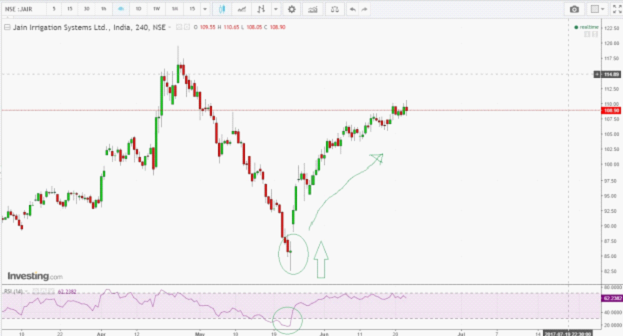
In figure 5, in recent 4 hourly charts of Jain Irrigation, we can see RSI entering ’30-70’ zone from an oversold region and we can see a follow up upward movement after confirmation of hammer in candlestick chart (figure 5).
Trading RSI divergences:
Often it is observed that there are divergences between price and RSI movement.
In an uptrend, when price keeps on making higher highs, while RSI indicator fails to make newer highs, a bearish divergence is created.
These kinds of divergences can be traded on the downside, once a bearish reversal pattern is confirmed or a support level is taken out.
In the following weekly chart of Sun Pharma, such a divergence is clearly visible (figure 6).
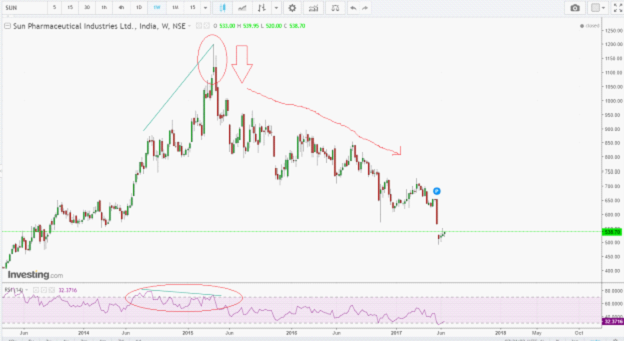
Even if we see that prices are at previous high, while RSI is at a much lower level than that corresponds to the previous high, one should keep a vigilant eye for bearish reversal price pattern.
A bearish reversal can provide a good follow up down move.
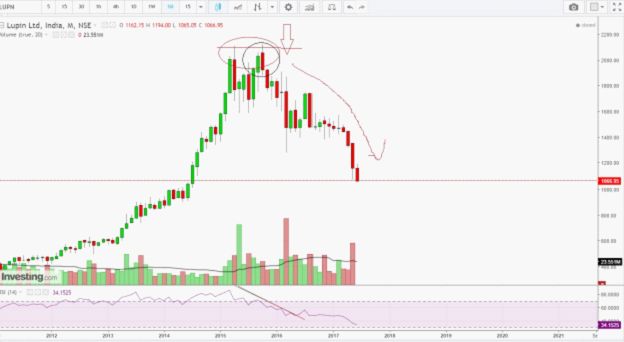
In the following Lupin monthly chart, we can find that prices have come back to previous high, while the monthly RSI shows, considerable bearish divergence.
Then after a dark cloud cover is confirmed in the price chart, we see a substantial down move (figure 7).
In a similar way, a bullish divergence is formed when we see, prices are making newer lows, while RSI indicator fails to make newer lows.
A decisive break above with a significant reversal pattern often provides good upside.
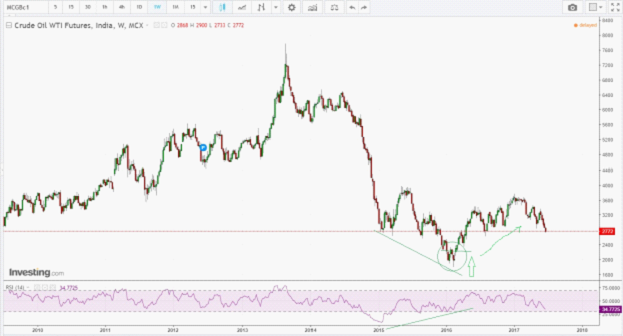
In the following weekly chart of MCX crude oil, such a divergence was visible.
When the prices broke above the double bottom chart pattern, we got a good 50 % rally from 2400 to 3600 (figure 8).
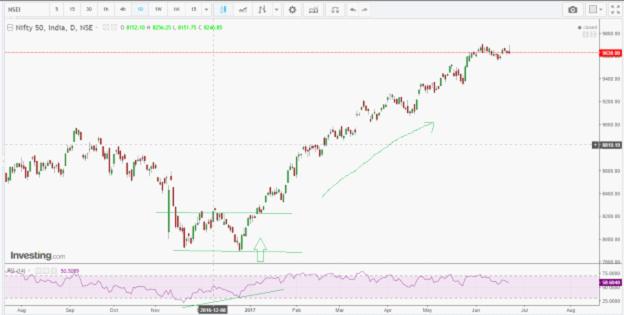
Even if the prices come down to the previous lows while RSI shows divergence, we should be looking for any possible bullish reversal.
Here in the Nifty daily chart, RSI showed bullish divergence with price moving to previous low, while RSI making a higher low.
Eventually, a break above this double bottom resulted in a significant rally (figure 9).
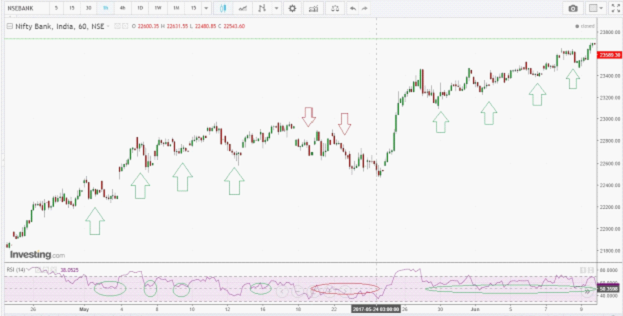
Support resistance at the midpoint of RSI line during bull and bear phases:
In a bull phase of the market, the mid-line (50) of RSI ’30-70’ range provides multiple low-risk buying opportunities as the RSI spends most of the time between 50-80.
In a bear phase midline (50) provides multiple shorting opportunities as RSI spend most of the time in 50-20 range.
In the following hourly chart of the Bank Nifty, we can see both the scenarios highlighted (figure 10).
Get to know about effective use of RSI Indicator for successful trading.
Also, for traders who are unable to devote time in studying charts of all the securities, scan section in StockEdge mobile app provides an easier way to track certain trade opportunities based of RSI absolute level or movement of RSI index.
The app provides an opportunity to club RSI strategy with other indicators, volume, and price patterns base strategies on EOD basis.
Bottomline:
The quality of a buy or a sell signal generally depends upon the inherent characteristics of the underlying security.
Thus, RSI should be used in tandem with other technical indicators to generate better trading signals.
Feel free to give your feedback by writing in the comment box below.
Happy Learning!!