What is Bollinger Bands in Technical Analysis?
We are creatures of emotion, creatures bristling with prejudices and motivated by pride and vanity. As creatures of emotion, we crave predictability and order. We struggle to find patterns in its absence. But surprisingly — from the mutation of genes to the process called diffusion — randomness is essential to the workings of nature — and perhaps even required for human beings to exist at all.
“Everything gives way and nothing stays fixed”– Heraclitus
As today is the first day of the remainder of our lives, so you and I, being a participant in the stock market, should take it seriously. Go on reading, you will be able to relate it soon.
You know Mr. Market also vibrates. Surprised? Yes, there is a term called volatility which is inseparably interrelated to the financial market. If you want to understand the term volatility in a lucid way, you can use the term “speed”. Let me quote Albert Einstein:
“As far as the laws of mathematics refer to reality, they are not certain; and as far as they are certain, they do not refer to reality.”
In this era of predictive analytics also we have to advertise our ignorance because we cannot predict future with the precision. If you and I could do that, by now we would have been on the list of top five richest persons in the world. Right? Haha!
There is an old saying on Wall Street that the market is driven by just two emotions which are greed and fear. These two intrinsic emotional states relate the word “uncertainty” to the stock market. Succumbing to these emotions can have an “utter and deleterious effect” on investors’ portfolios and the stock market.
Believe me, the superfluity of information on “volatility” will drown your head in massive “noise” of the financial market. According to Nassim Nicholas Taleb, the terms “bull” and “bear” have limited meaning outside of zoology because of the concept of skewness. Median and expected do not mean the same thing at all in the financial world. The terms bullish and bearish are often hollow words with no application in a world of randomness – particularly if such a world, like ours, present asymmetric outcomes.
“Suppose we use the standard deviation of possible future returns on a stock as a measure of its volatility. Is it reasonable to take that volatility as a constant over time? I think not.” — Fischer Black
It is widely accepted today that an assumption of a constant volatility fails to explain the existence of the volatility smile as well as the leptokurtic character (fat tails) of the stock distribution. The above Fischer Black quote, made shortly after the famous constant-volatility Black-Scholes model was developed, proves the point.
You must be knowing that the sharpest of all sharp brains are involved in this stock market with different mathematical models and statistical tools to quantify volatility and estimating the underlying price. It is beyond the scope of this article to articulate those complex structures in words.
To keep it simple and precise for trading, it would be better to study the Bollinger bands.
Bollinger Bands Indicator
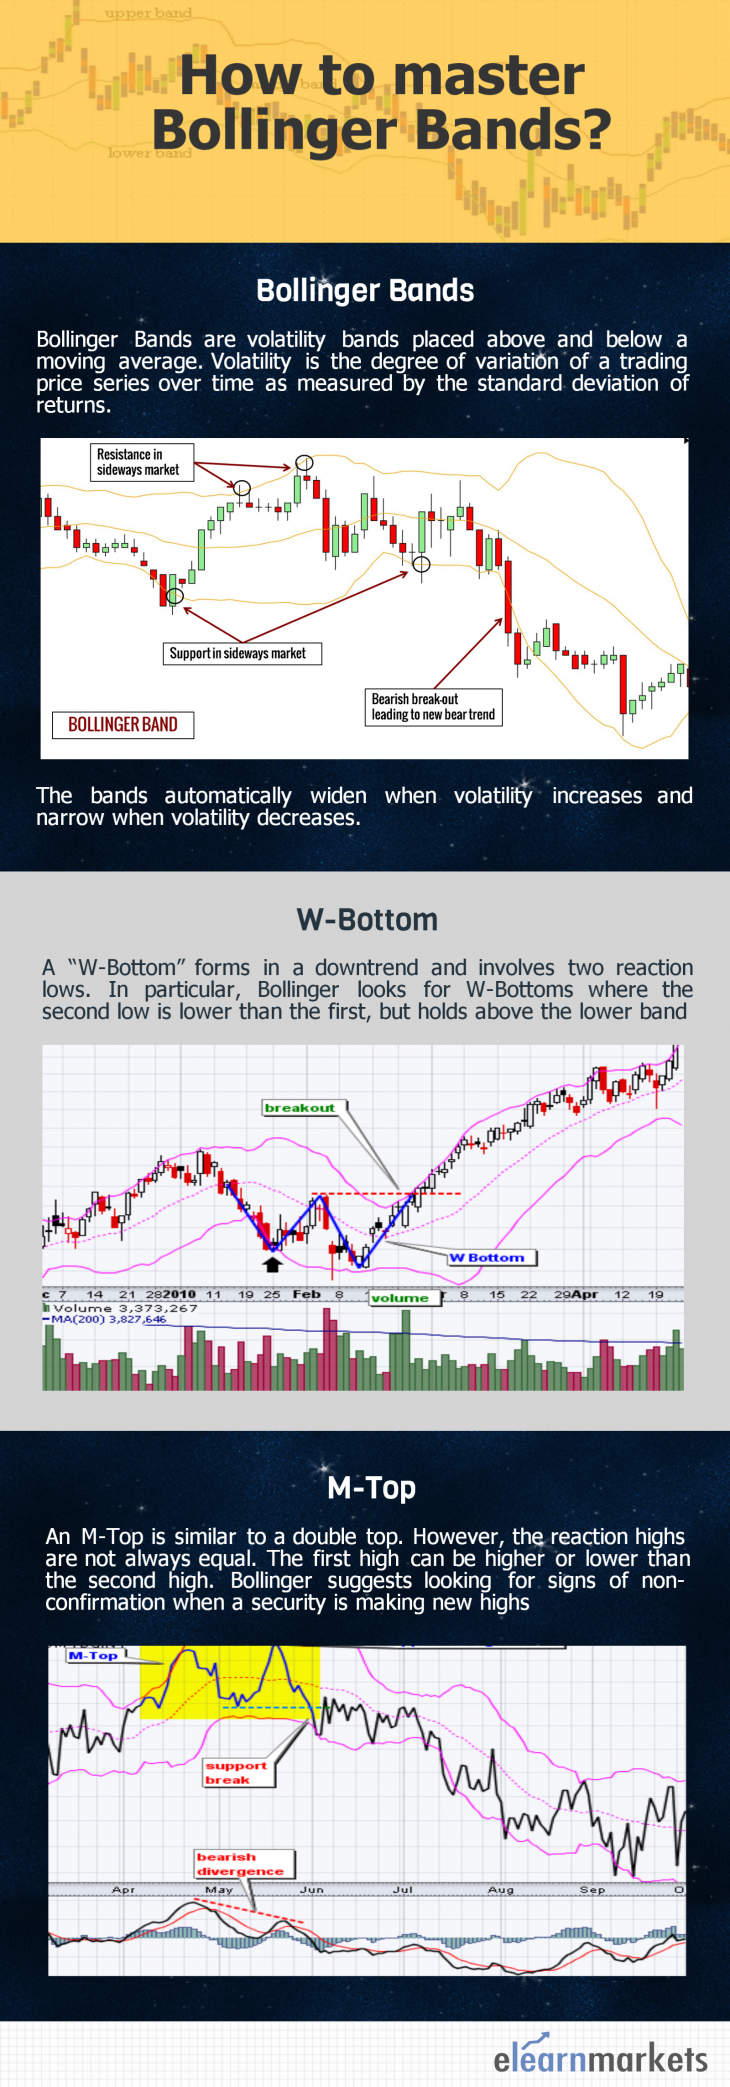
In 1980s a tool named “Bollinger Bands” was invented by John Bollinger. These bands are volatility indicators similar to the Keltner Channel. Except that Bollinger Bands are placed two standard deviations above and below the moving average which is usually 20 days. To know more on Keltner Channel
Bollinger Bands Formula
It evolved from the concept of trading bands. Two trading bands are placed around a moving average similar to the envelope technique. For your simplicity I am breaking it down:-
- An N-period moving average(MA)
- An upper band at K times an N-period standard deviation above the moving average (MA + Kσ)
- A lower band at K times an N-period standard deviation below the moving average (MA − Kσ)
Also Read: Why Moving Average is important for your technical toolbox?
The values for N and K are 20 and 2. Normally Simple Moving Average is preferred to Exponential Moving Average because it is used in calculating the volatility used to set the bandwidth, hence, it is internally consistent to use the same average to set the center point. Moreover, for both the middle band and calculation of standard deviation usually, the same period is used. For a 20 day average, the most recent 20 days are used. The next day the oldest day’s data is discarded and the newest included. The same is true for volatility; for each period, the volatility is measured using the immediately preceding periods.
Also Read: How to trade using moving average on different timeframes?
You must be knowing that Standard Deviation (S.D.) is a statistical concept which describes how prices are dispersed around an average value. The importance of using two standard deviations is that it ensures that 95% of the price data will fall between the two trading bands. To know the process of calculation of standard deviation you can always consult our common guide “Google”.
The default for Bollinger bands are: 20-day calculation and ± 2 standard deviations. Surprisingly you will find that as you shorten the calculation period, you will need to reduce the number of standard deviations used to set the bandwidth and that as you lengthen the number of periods, you will need to widen the bandwidth.
According to Bollinger if you use a starting point of 2 standard deviations and a 20-period calculation, you should decrease the bandwidth to 1.9 standard deviations at 10 periods and increase it to 2.1 standard deviations at 50 periods. But none of the strategies are more important than the evolution of the markets.
If the period is less than 10 or greater than 50, changing the periodicity of the bars is more appropriate. Suppose if you require a shorter calculation period than 10 days, a shift to hourly bars might be better than trying to squeeze the calculation period ever tighter.
I want to add one more variation of Bollinger, i.e. multiple bands at the same time. It can be done in two ways. One is to plot multiple bands using the same calculation periods, say 20 periods, but differing bandwidths, 1 & 2 standard deviations for example. The other is to plot multiple sets of bands with different parameters, say 20 periods and 2 standard deviations and 50 periods and 2.1 standard deviations, on the same chart.
Also Read: Basic Toolkit for Stock Market Beginners
As a thumb rule, prices are considered to be overextended on the upside (overbought) when they touch the upper band. They are considered overextended on the downside (oversold) when they touch the lower band. The statistical concept behind the technical terms overbought and oversold is that as prices depart from the average, you and I should expect them to move back toward the average.
Note: Bollinger bands are used to provide a relative definition of high and low. At the upper band, prices are high and vice-versa. It helps us in pattern recognition and developing our own strategy.
I want to provide another information. Bollinger further developed 3 new indicators based on his own bands.
- BBImpulse – It helps to measure the change in price as a function of the bands.
- Percent Bandwith (%b) – It is used to normalize the width of the bands over time.
- Bandwidth delta – It helps to quantify the changing width of the bands.
Volatility and Band Width
Yes, bandwidth measures volatility.
How do Bollinger Bands work?
Using Bollinger Bands as targets
By now you must have got an idea about the use of Bollinger bands. The most common way to use it is keeping the upper and lower bands as price targets. Suppose if prices bounce back from the lower band and cross above the 20-day average, then the upper band becomes the price target on the upside and vice-versa. Normally the price level oscillates inside the upper band and the 20 day average in case of a strong uptrend, whereas it just the opposite in case of a strong downtrend.
During a period of rising price volatility, the distance between the two bands will widen, whereas during a period of low volatility the bands will contract. Usually, the contraction and extraction come alternately. Okay. I will break it down for better clarity. Before proceeding further you should know that volatility is cyclical even when the price is not.
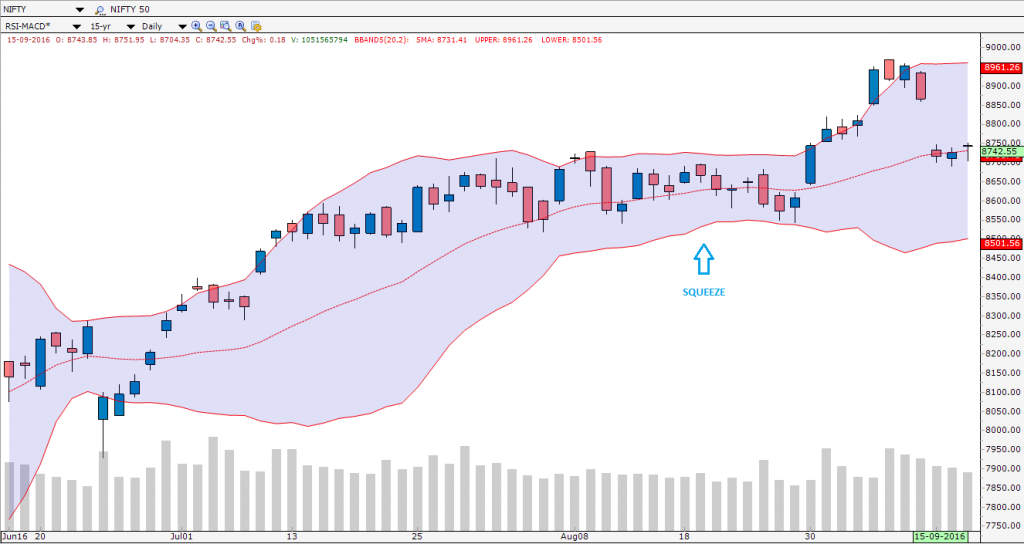
The Squeeze
Please remember these points. During a period of low volatility, the bands come closer constricting the moving average. It is a sign that a market may be about to initiate a new trend and traders use this as possible trading opportunities in the future because you know after contraction come the expansion/explosion phase. This rule is never broken. Bollinger bands are driven by volatility and “the squeeze” is a pure reflection of that volatility. When volatility falls to historically low levels, the squeeze is on. An indicator named “Bandwidth” was created in order to measure. Normally the squeeze is triggered when bandwidth drops to its lowest level in six months. Often as the end of a squeeze nears, the price will stage a short fake-out move, and then abruptly turn and surge in the direction of the emerging trend.
To deal with the head fake, you can wait for the move to develop sufficiently so that there is a little question about the nature of the emerging trend. Or if you want to trade the squeeze right from the beginning you can take an initial position in the direction of the fake and use the trailing stop loss technique.
After low volatility, high volatility comes to the table. Hence, when a powerful trend is born, volatility expands so much that the lower band will turn down in an uptrend and vice-versa. But you know it works very well when combined with other indicators and oscillators.
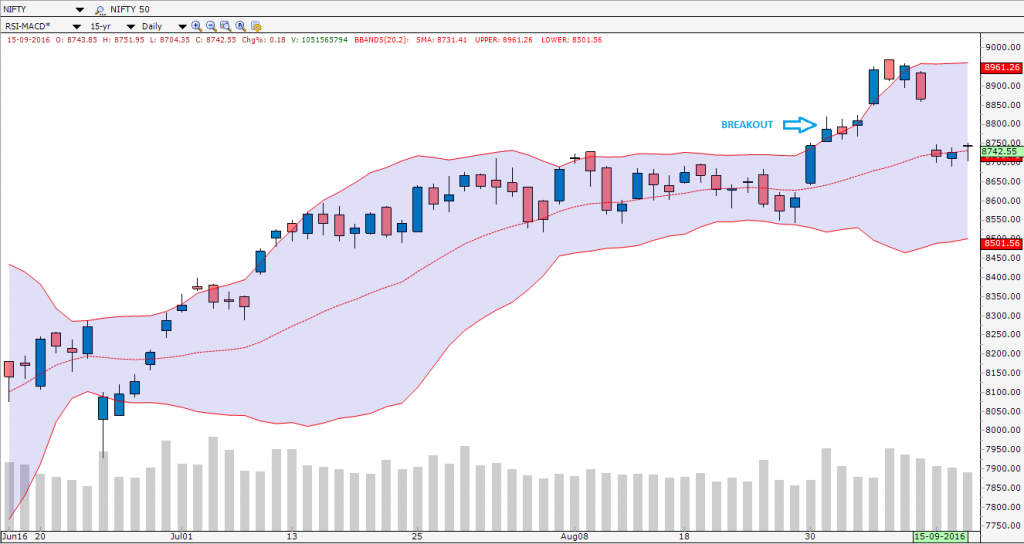
The Breakout
Usually, the maximum lifespan of the price movement occurs inside the two bands. When the price breaches on either side it is called breakouts. When combined with other factors it can provide some clues.
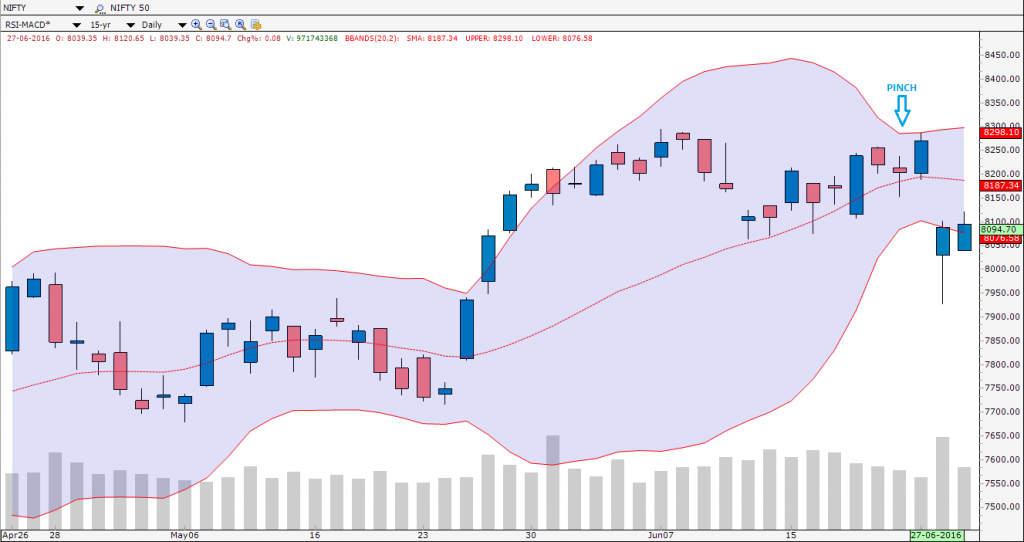
 The Pinch
For simplicity, you should consider this point as well. As mentioned earlier that expansion follows contraction and the process is repeated. Hence, when the level of volatility decreases from an expansion phase, it is sometimes known as pinch pattern.
As you know that a table looks stable in four legs, sometimes three is okay but less than that it behaves like a drunken person. Likewise any trade irrespective of trend following, contrarian or swing you should consider at least three conditions to fulfill. It will not only help you to make better actions but also will gradually get reflected in your portfolio.
Price as a dancer gives a signal
Laughing? Okay, enjoy the dance. There are two forms of signals, i.e. M-Top and W-Bottom.
M-Top
Bollinger used the concepts of M-patterns in his own bands to spot the M-Top. Among the possible patterns that can form M-Top are double tops, head and shoulders, and diamonds. The ideal M-Top is formed when
Step 1) The price level makes a high outside the upper band or at least touch the upper band
Step 2) The price is pulled back towards the middle band
Step 3) Price level bounces back towards the upper band. Ideally should be lower than the prior high and below the upper band
Step 4) Volume will be higher on the first advance than on the second
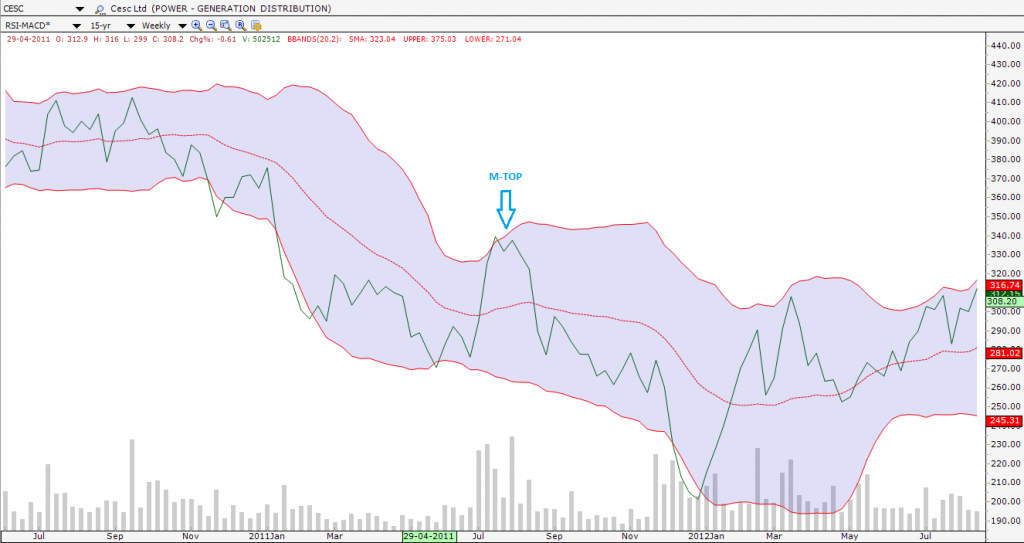
Isn’t it interesting? Now let’s go on to the interpretation…
This tops act as a warning sign. Moreover, the weakness of the trend is reflected when the second high fails to touch the upper band. The momentum loses its strength and has a possibility to reverse. Considering other factors one can easily go for a contra trade.
W-Bottom
Just like the M-top, the possible patterns that can form W-Bottom are double bottoms, inverted head, and shoulders. The ideal W-Bottom is formed when
Step 1) The price level makes a low outside the lower band or at least touch the lower band
Step 2) The price is bounced back towards the middle band
Step 3) Price level is pulled back towards the lower band. Ideally should be higher than the prior low and above the lower band
Step 4) Volume will be higher on the first decline than on the second
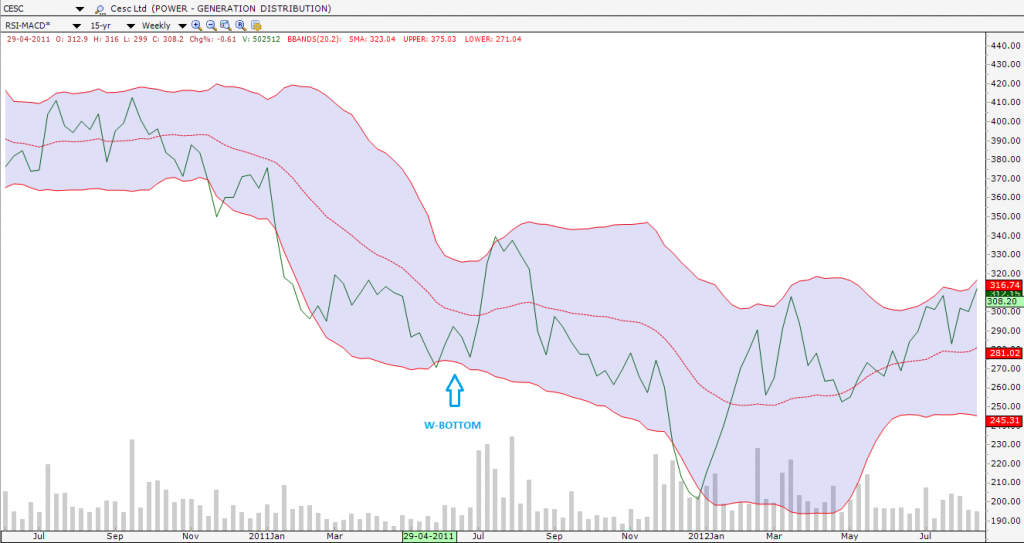
This bottoms act as a warning sign. Moreover, the weakness of the trend is reflected when the second low fails to touch the lower band. The momentum loses its strength and has a possibility to reverse. Considering other factors one can easily go for a contra trade.
You know along with volume indicators momentum indicators can be very useful in the diagnostic process. As you know that each indicator operates independently of the other, so when they signal together, they afford a high level of confidence in the outlook for the stock.
Bollinger Bands Trading Strategy
- One should actually buy when the upper band is exceeded and short when the lower band is broken to the downside
- One should buy on strength as one approach the upper band only if an indicator confirms and sell on weakness as the lower band is approached, if and only if confirmed by other indicators
- One should buy near the lower band, using a W pattern and an indicator to clarify the setup and vice-versa
Watch the video below to know How to trade with Bollinger Bands:
Bottomline
Some of the concepts mentioned here are the results of my speculation based on the theories of John Bollinger and John Murphy. There is a ‘non-zero possibility that the above strategies and conclusions are flawed. Hence, instead of taking them at face value, please consider them as starting points to stimulate your own independent thought process’. You must be knowing that cells that fire together, wire together.
As an expression of gratitude, I would like to thank you for taking the trouble to read up to this sentence. I hope you got some clarity on “Bollinger Bands”.
Be free to leave your suggestions or comments or questions in the space below.