Tweezer candlestick – What are Tweezer Top & Bottom Candle?-ok

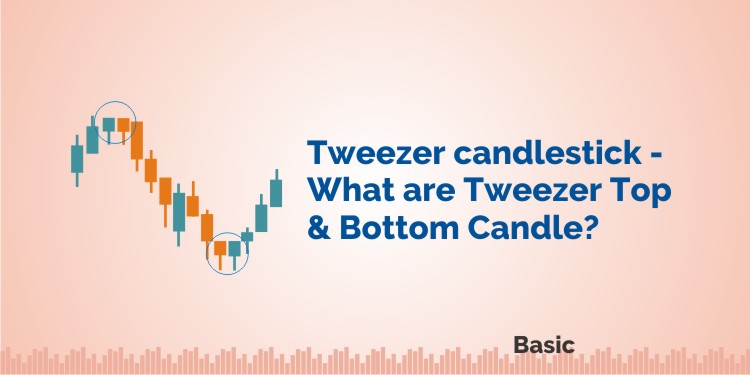
Tweezer candlestick patterns are two candlestick trend reversal pattern.
Tweezer top indicates a bearish reversal whereas Tweezer bottom indicates a bullish reversal.
Tweezer top candlestick pattern occurs when the high of two candlesticks are almost or the same after an uptrend.
Tweezer bottom candlestick pattern occur when the low of two candlesticks are almost or the same after a downtrend.
Let us about these two tweezer candlestick pattern in details:
What is the Tweezer Top pattern?
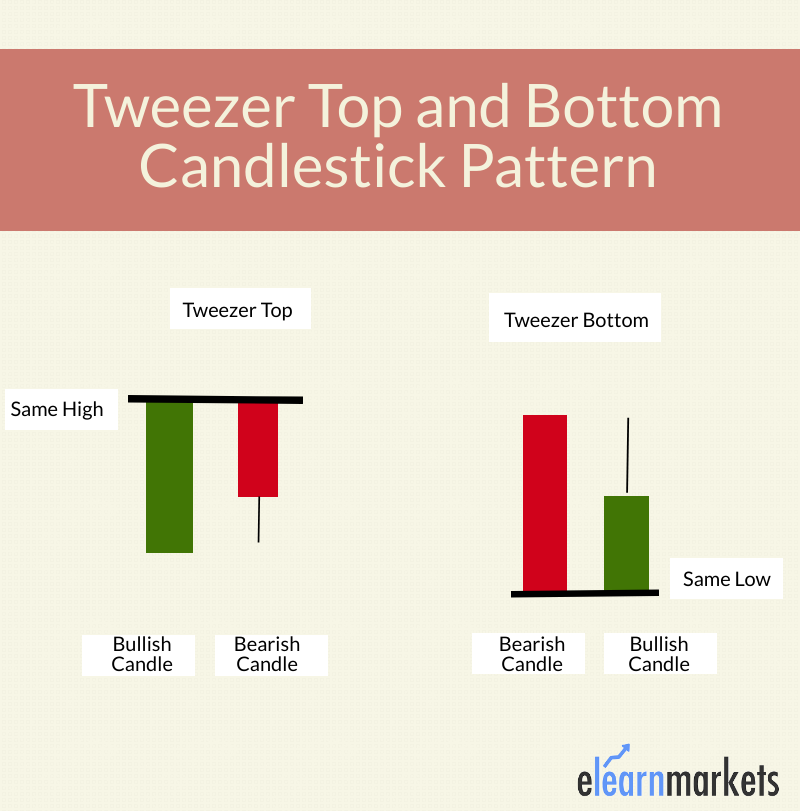
The Tweezer Top pattern is a bearish reversal candlestick pattern that is formed at the end of an uptrend.
It consists of two candlesticks, the first one being bullish and the second one being bearish candlestick.
Both the tweezer candlestick make almost or the same high.
What is the Tweezer Bottom pattern?
The Tweezer Bottom candlestick pattern is a bullish reversal candlestick pattern that is formed at the end of the downtrend.
It consists of two candlesticks, the first one being bearish and the second one being bullish candlestick.
Both the candlesticks make almost or the same low.

How to identify Tweezer Top and Bottom Candlestick Patterns?
Below are some points that should be kept in mind when identifying Tweezer Top on the candlestick charts:
- The prior trend should be an uptrend
- A bullish candlestick should be formed on the first day of this pattern formation.
- On the next day, a bearish candle should be formed having a similar high of the previous day’s candlestick.
Below are some points that should be kept in mind when identifying Tweezer Bottom on the candlestick charts:
- The prior trend should be a downtrend
- A bearish candlestick should be formed on the first day of this pattern formation.
- On the next day, a bullish candle should be formed having a similar low of the previous day’s candlestick.
To know about other candlesticks, read our blog on All 35 Candlestick Chart Patterns in the Stock Market-Explained
What does Tweezer Top Candlestick Pattern tell us?
When the Tweezer Top candlestick pattern is formed the prior trend is an uptrend.
A bullish candlestick is formed which looks like the continuation of the ongoing uptrend.
On the next day, the high of the second day’s bearish candle’s high indicates a resistance level.
Bulls seem to raise the price upward, but now they are not willing to buy at higher prices.
The top-most candles with almost the same high indicate the strength of the resistance and also signal that the uptrend may get reversed to form a downtrend.
This bearish reversal is confirmed on the next day when the bearish candle is formed.
What does Tweezer Bottom Candlestick Pattern tell us?
When the Tweezer Bottom candlestick pattern is formed the prior trend is a downtrend.
A bearish tweezer candlestick is formed which looks like the continuation of the ongoing downtrend.
On the next day, the second day’s bullish candle’s low indicates a support level.
The bottom-most candles with almost the same low indicate the strength of the support and also signal that the downtrend may get reversed to form an uptrend.
Due to this the bulls step into action and move the price upwards.
This bullish reversal is confirmed the next day when the bullish candle is formed.
Importance of this pattern:
When the traders see the formation of tweezer top and bottom candlestick patterns on the charts, they should get cautious that reversal is going to place.
They should square off their position when this reversal pattern formed.
They should also confirm the formation of tweezer candlestick pattern with other technical indicators.
Key Takeaways:
- Tweezer Top and Bottom candlestick is a trend reversal pattern which involves two candlesticks.
- Tweezer top candlestick indicates a bearish reversal whereas Tweezer bottom indicates a bullish reversal.
- When the traders see the formation of tweezer candlestick patterns on the charts, they should get cautious that reversal is going to place.
- Traders should also confirm the formation of tweezer candlestick pattern with other technical analysis indicators.


