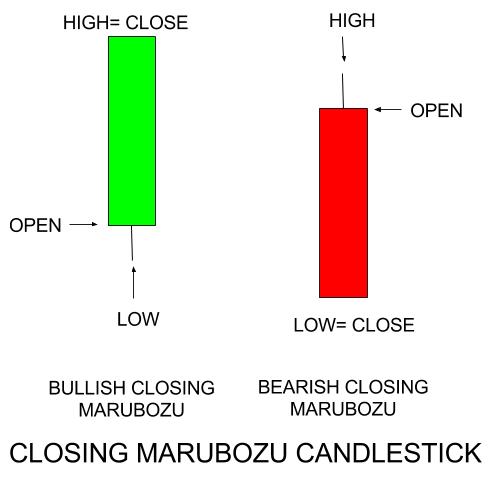
Japanese Candlestick Pattern: MARUBOZU
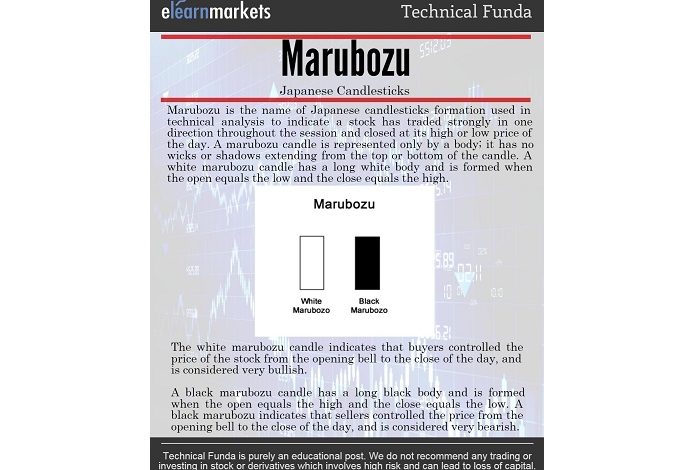
A Marubozu is a hard to miss candlestick with a full long body and barely any shadows.
This solid body indicates a strong movement in any particular direction may it be upside or downside.
When a bullish (green/white) Marubozu is formed, it indicates that the moment the price opened, they traded higher and higher finally closing in the mid of an attempt to rise further.
In simple term, the day’s low is formed at the opening price itself and the day’s high is formed when the trading session ends.
Similarly, in a Bearish (Red or Black ) version, the opening and high price are the same where the closing occurs at the close of the day.
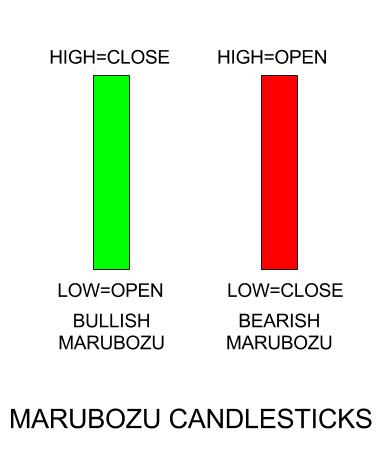
What is Opening Marubozu?
Now, this a textbook perfect definition and a rather rare occurrence.
A perfect Marubozu is extremely rare on a daily or weekly chart, however, in the intraday charts, they may be observed during periods of very volatile and strong movements.
A more practical version of this japanese candlestick is the Opening and Closing Marubozu.
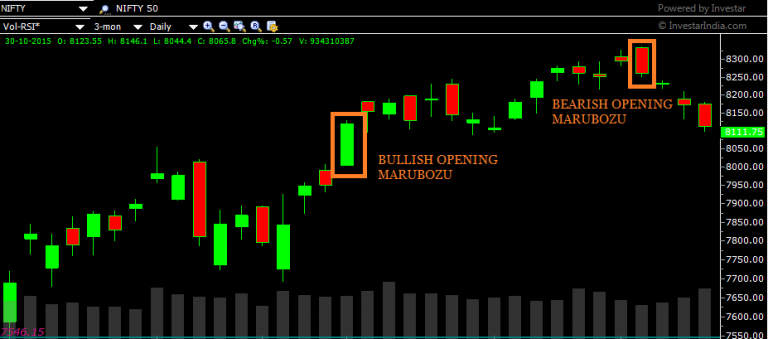
This candlestick pattern occurs when the opening price occurs at the high or low of the day.
When the opening price is equal to the high of the day, it is bearish and when it is at the low of the day it is bullish Marubozu.
Also Read: All you need to know about the Japanese Candlestick
It signifies that as soon as the opening bell rang, the bears or the bulls took charge and pushed the prices in the direction for the rest of the session.
In case of Bearish pattern, traders who have a long position do not get a chance to exit the trade as the price slips down without a breather, and in a bullish pattern, the bulls take charge as soon as the trading starts and any initial short trader would be badly stuck.
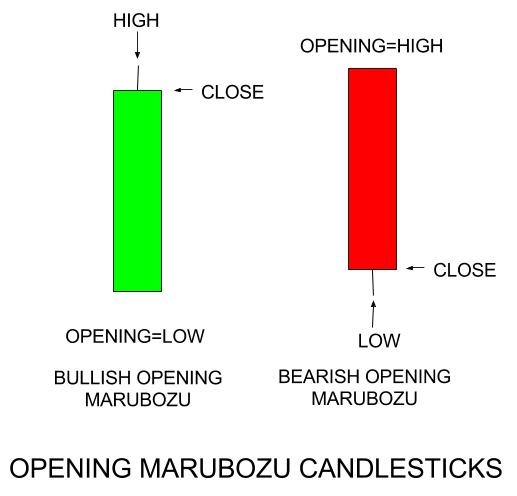
What is Closing Marubozu?
The closing Marubozu is a stronger candlestick pattern.
It is formed when the close price is equal to the high or the low of the day.
When the close price is equal to the low then it is called bearish and when the close is equal to the high it is a bullish Marubozu.
Learn in 2 hours: Identify Trend Reversals with Candlesticks
It indicates that not only did the prices maintained the move in a single direction after initial jitters during the opening, in fact, the participants maintained the sentiments till the end moment of the trading session.
Thereby, it is expected that when the trading session reopens, the price will continue moving in the direction of the close. It is again a rare pattern to observe.
To know about other candlesticks, read our blog on All 35 Candlestick Chart Patterns in the Stock Market-Explained
Examples of Japanese Candlestick Pattern
In order to get the latest updates of Financial Markets visit https://stockedge.com/