Technical Analysis
-
What is Bollinger Bands in Technical Analysis?
We are creatures of emotion, creatures bristling with prejudices and motivated by pride and vanity. As creatures of emotion, we crave…
Read More » -

How to trade with Spinning Top: Candlestick Pattern
A spinning top candlestick , like any other candlestick patterns, does not give us a trading signal for entering or…
Read More » -
RSI Indicator and How is it useful in Trading Stocks?
I start with the disclaimer that the following answer is for academic discussion only and not in the way meant…
Read More » -
Technical Indicator that reflect Volatility in the Market
The stock market not only consolidates or trends but also deals with different types of technical indicator volatility in the…
Read More » -
Difference between Candlestick Pattern and Chart Pattern
Identifying patterns is one of the biggest tasks for any trader in the stock market. This is where candlestick patterns…
Read More » -
Applying your favourite scans for quick ideas.
When we start trading we often get confused about which stock to buy or which to sell. There are so…
Read More » -

Basic Understanding Of Candlestick Charts
It is extremely important to have a basic understanding of the candlestick chart patterns to help us in quickly understand…
Read More » -
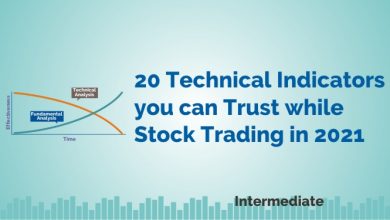
20 technical indicators you can trust while stock trading in 2021
Technical indicators are technical tools that help in analyzing the movement in the stock prices whether the ongoing trend is…
Read More » -
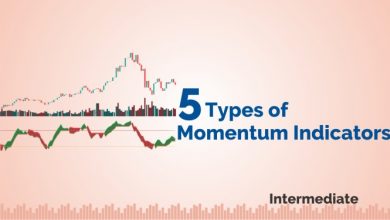
Top 5 Momentum Indicators that Analyses Trend Strength
Momentum indicators help the traders to understand the speed at which the price of particular stock changes. These indicators help…
Read More » -
Master Stock Technical Analysis for Beginners-ok
Technical analysis refers to the analysing of the past data of the price movement and forecasting future price movements. Technical…
Read More »