Hanging Man Candlestick Pattern – What you should know?
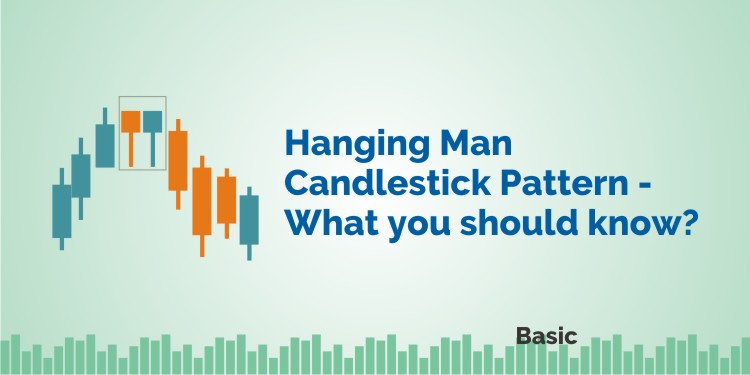
Hanging Man candlestick pattern is a single candlestick pattern that if formed at an end of an uptrend.
It is a bearish reversal pattern that signals that the uptrend is going to end.
This also indicates that the bulls have lost their strength in moving the prices up and bears are back in the market.
Let us discuss this single reversal candlestick pattern in details:
What is the Hanging Man Candlestick Pattern?
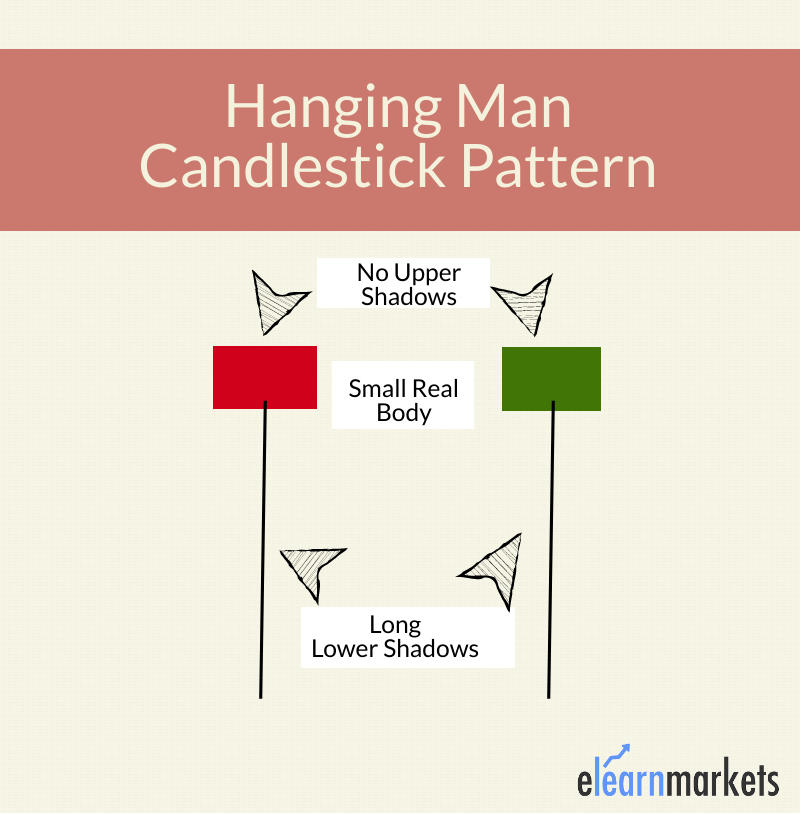
Hanging man is a bearish reversal candlestick pattern that has a long lower shadow and small real body.
This candlestick pattern appears at the end of the uptrend indicating weakness in further price movement.
It is formed when the bulls have pushed the prices up and now they are not able to push further.
This candlestick chart pattern has a small real body which means that the distance between the opening and closing price is very less.
There is no upper shadow and lower shadow is twice the length of its body.
This pattern provides an opportunity for traders for squaring their buy position and entering a short position.
Formation of this Pattern:
Here is the formation of the Hanging Man Candlestick Pattern:
What does Hanging Man tell us?
Traders should look at a few characteristics of this pattern and take advantage of the formation of this pattern.
The long lower shadow of this pattern indicates that the sellers have entered the market.
Usually, pattern with longer lower shadows seems to have performed better than the Hanging Man with shorter lower shadows.
This candlestick pattern can be either green or red but this does not play a significant role in the interpretation of this candlestick pattern.
Learn to Identify Trend Reversals with Candlesticks in just 2 hours by Market Experts
The signal given by this pattern is confirmed when the bearish candle is formed on the next day.
The traders should also analyze if the volume has increased during the formation of this pattern.
Traders can enter a short position at the closing price of this candlestick or at the opening price of the next bearish candlestick.
A stop-loss can be placed at the highest point of the this candlestick.
Criteria for Identifying this pattern:
Below are some points that should be kept in mind when identifying this pattern on the candlestick charts:
- There so be no or little upper shadow
- The lower shadow should be long as twice the length of the real body
- The real body should be on the upper side of the candlestick.
To know about other candlesticks, read our blog on All 35 Candlestick Chart Patterns in the Stock Market-Explained
Trading Example:
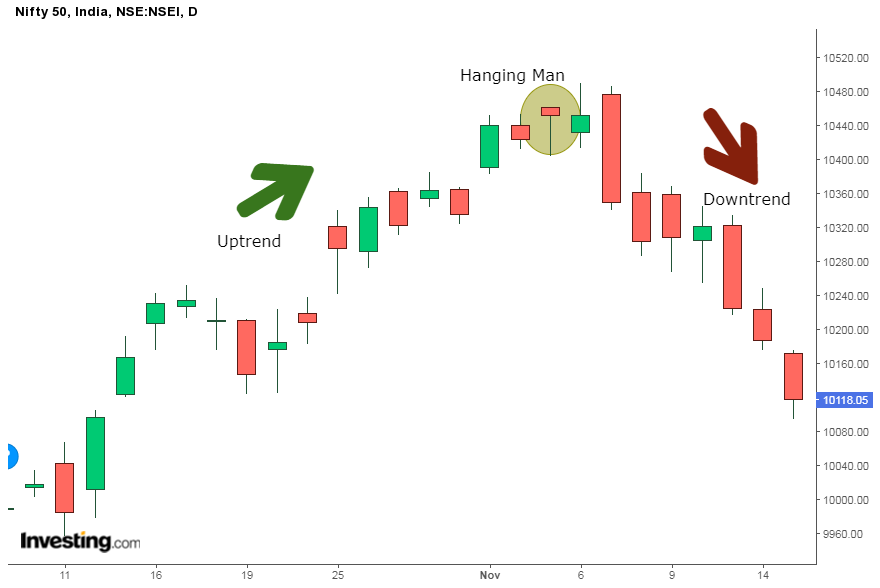
We can see the formation of the Hanging Man candlestick pattern on the Daily chart of Nifty 50 below:
Difference between Hanging Man, Shooting Stars, and Hammers:
Shooting Stars and Hammers are two other similar candlestick patterns that can lead to confusion when identifying Hanging Man.
It is formed near the end of an uptrend, and also the shooting stars.
The real body of this pattern is at the upper end of the entire candlestick and has a long lower shadow.
On the other hand, a shooting star candlestick pattern has a small real body at the bottom of the candlestick and has a long upper shadow.
The formation of both the hanging man and the hammer is similar.
It indicates a bearish reversal whereas the Hammer indicates a bullish reversal.
Key Takeaways:
- Hanging Man candlestick pattern is a single candlestick pattern that if formed at an end of an uptrend.
- Traders should look at a few characteristics of this pattern and take advantage of the formation of this pattern.
- Shooting Stars and Hammers candlestick pattern are two other similar candlestick patterns that can lead to confusion when identifying this pattern.
- Traders can enter a short position at the closing price of this candlestick or at the opening price of the next bearish candlestick.
