Piercing Pattern – How to trade with Piercing Candlestick?-ok
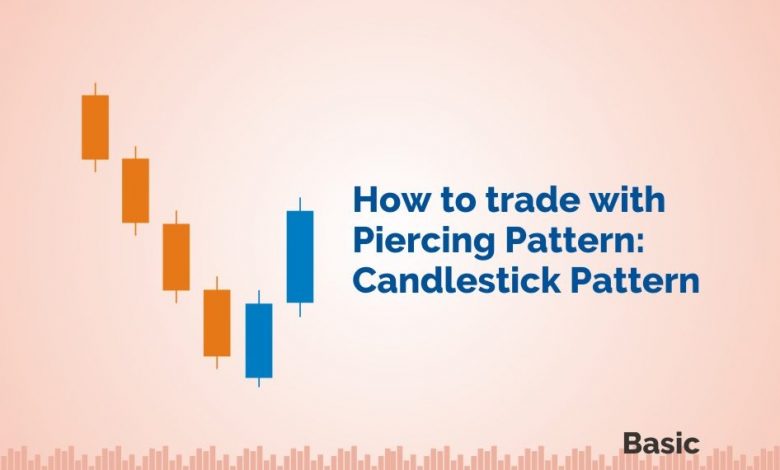
A piercing pattern is a candlestick pattern formed near the support levels, and it gives us potential bullish reversal signs.
It is found towards the end of a downtrend and is quite similar to the dark cloud cover.
The only difference is that dark cloud cover signals a bearish reversal, whereas a piercing pattern signals a bullish reversal.
This kind of pattern is made of two candlesticks, the first one is bearish, and the second one is the bullish candlestick.
But is this candlestick that easy to use when you use technical analysis to trade in the stock market?
Let us find out below:
What is a Piercing Pattern?
It is a bullish reversal pattern that can be found at the end of a downtrend.
This candlestick pattern is used as an indicator to enter a long position or exit the sell position.
This kind of pattern is formed when the bulls and bears, both are fighting to gain control over the prices.
The piercing pattern is made up of two candlesticks.
The first candlestick should be red candlestick having a large real body and the second candlestick should be green in colour and also should below the low of the previous candlestick.
The second candlestick must close above the middle of the real body of the first candlestick.
Both the candlesticks should be Marubozu with no upper or lower shadows.
Formation of Piercing Candlestick Pattern
Here is the formation of the Piercing Pattern:
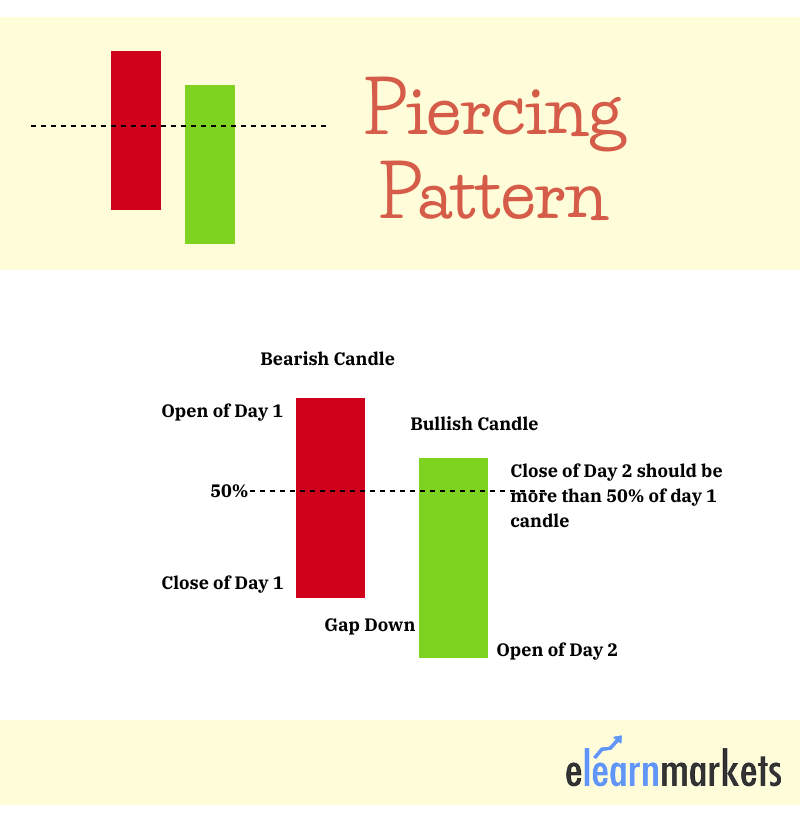
As the market is already in a downtrend, the opening price is high and the selling activity continues.
At the end of the trading session, the closing price reaches the bottom and thus a bearish candle is formed.
This bearish candlestick is usually a Marubozu having no upper or lower shadows.
Also Read : Japanese Candlestick Pattern: MARUBOZU
The opening of the next candlestick is below the closing point of the previous bearish candlestick.
There is an increase in the demand by the bulls and the price starts rising.
At the end of the day, the bulls are successful in making the price rise, and the closing price is more than the middle of the previous bearish candlestick.
How to use Piercing Pattern?
Investors must look at a few characteristics when they trade with the piercing pattern:
- Firstly, the trend should be downtrend, as the pattern is a bullish reversal pattern.
- Secondly, the length of the candlestick plays an important role in determining the force with which the reversal will take place.
- The gap down between the bearish and bullish candlesticks indicates how powerful the trend reversal will be.
- Fourthly, the bullish candlestick should close more than the midpoint of the previous bearish candlestick.
- Lastly, the bearish, as well as the bullish candlestick, should have larger bodies.
Below is an example of the piercing pattern in the daily chart of Sun Pharmaceutical Industries Ltd.
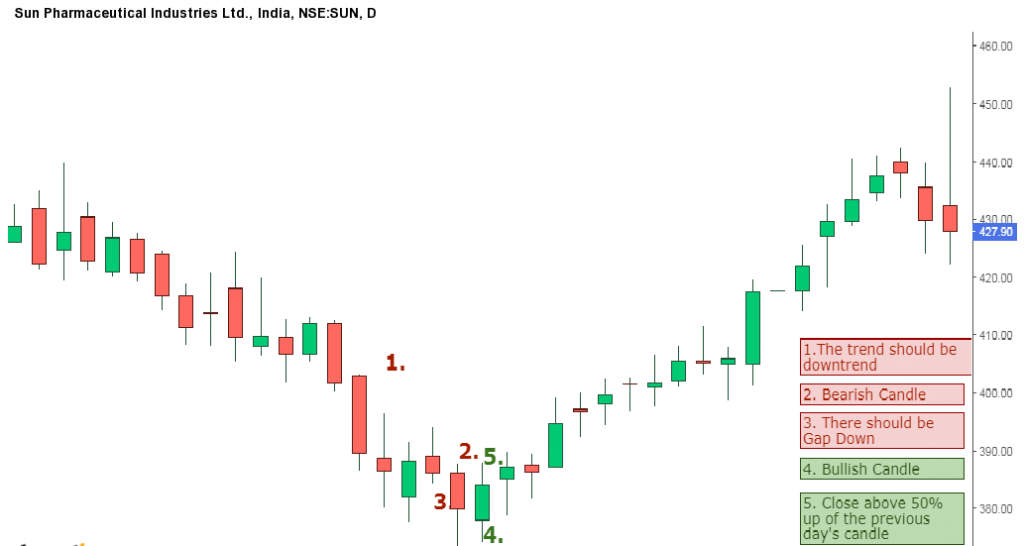
Here we can see that all of the characteristics mentioned above for trend reversal signaled by the piercing pattern are fulfilled so one can enter a long position.
To know about other candlesticks, read our blog on All 35 Candlestick Chart Patterns in the Stock Market-Explained
Ideal Trading setup for Piercing Pattern
When a trader sees a piercing candlestick chart pattern on a particular stock chart, he should wait until the high of the first candlestick is succeed by the previous bearish candle.
This is an ideal trade setup when trading with the piercing candlestick pattern.
The stop loss should low of the previous bearish candle.
This pattern is more suitable for day and swing traders as the rate of success are quite high in longer time-frames.
Also, don’t forget to confirm the signals given by this pattern with other technical indicators.
