All 35 Candlestick Chart Patterns in the Stock Market-Explained

Listen to this:
The candlesticks are used to identify trading patterns that help technical analyst set up their trades.
These candlestick patterns are used for predicting the future direction of the price movements.
The candlestick patterns are formed by grouping two or more candlesticks in a certain way.
Sometimes powerful signals can also be given by just one candlestick.
In this blog, we will discuss all 35 powerful candlestick patterns, but before that, let us discuss how to read candlestick charts.
How to Read Candlestick charts?
Candlestick charts were originated in Japan over 100 years before the West had developed the bar charts and point-and-figure charts. In the 1700s, a Japanese man known as Homma discovered that as there was a link between price and the supply and demand of rice, the markets also were strongly influenced by the emotions of traders.
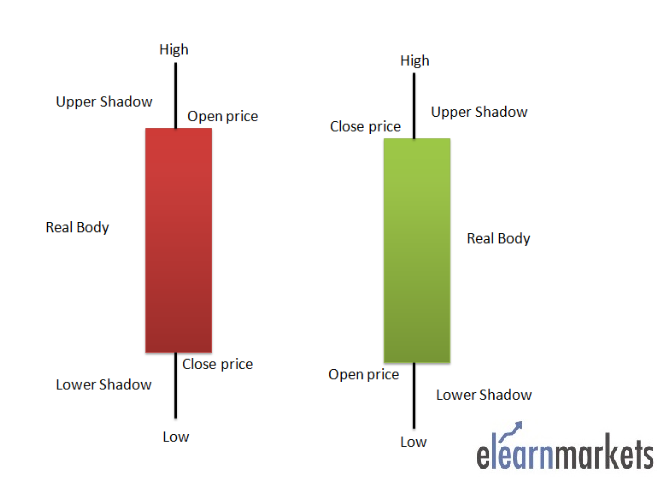
A daily candlestick charts shows the security’s open, high, low, and close price for the day. The candlestick’s wide or rectangle part is called the “real body” which shows the link between opening and closing prices.
This real body shows the price range between the open and close of that day’s trading.
When the real body is filled, black or red then it means that the close is lower than the open and is known as the bearish candle. It shows that the prices opened, the bears pushed the prices down and closed lower than the opening price.
If the real body is empty, white or green then it means that the close was higher than the open known as the bullish candle. It shows that the prices opened, the bulls pushed the prices up and closed higher than the opening price.
The thin vertical lines above and below the real body is knowns as the wicks or shadows which represents the high and low prices of the trading session.
The upper shadow shows the high price and lower shadow shows the low prices reached during the trading session.
Before we jump into learning about different candlestick charts, there are few assumptions which need to be kept in mind that are specific to the candlestick charts.
- Strength is represented by a bullish or green candle and weakness by a bearish or red candle. One should ensure that whenever they are buying it is a green candle day and whenever they are selling, ensure that it’s a red candle day.
- The textbook definition of a patterns states certain criteria, but one should state that there could be minor variations to the pattern depending on certain market conditions.
- One should look for a prior trend. If you are looking at a bullish reversal pattern, then the prior trend should be bearish and if you are looking for a bearish reversal pattern then the prior trend should be bullish.
35 Types of Candlestick Patterns:
The candlestick patterns can be divided into:
Below is the list of 35 Types of Candlestick Patterns which is categorised in the above categories:
Bullish Reversal Candlestick Patterns:
Bullish Reversal candlestick patterns indicate that the ongoing downtrend is going to reverse to an uptrend.
Thus, the traders should be cautious about their short positions when the bullish reversal candlestick chart patterns are formed.
Below are the different types of bullish reversal candlestick patterns:
1. Hammer:
Hammer is a single candlestick pattern that is formed at the end of a downtrend and signals a bullish reversal.
The real body of this candle is small and is located at the top with a lower shadow which should be more than twice the real body. This candlestick chart pattern has no or little upper shadow.
The psychology behind this candle formation is that the prices opened, and sellers pushed down the prices.
Suddenly the buyers came into the market and pushed the prices up and closed the trading session more than the opening price.
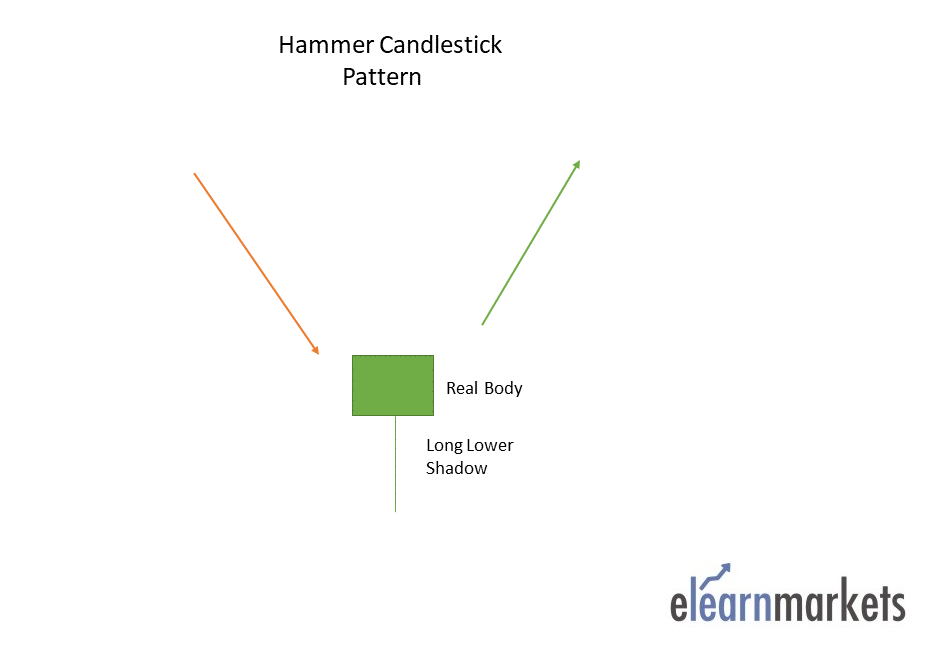
This resulted in the formation of bullish pattern and signifies that buyers are back in the market and downtrend may end.
Traders can enter a long position if next day a bullish candle is formed and can place a stop-loss at the low of Hammer.
Below is an example of Hammer candlestick pattern:
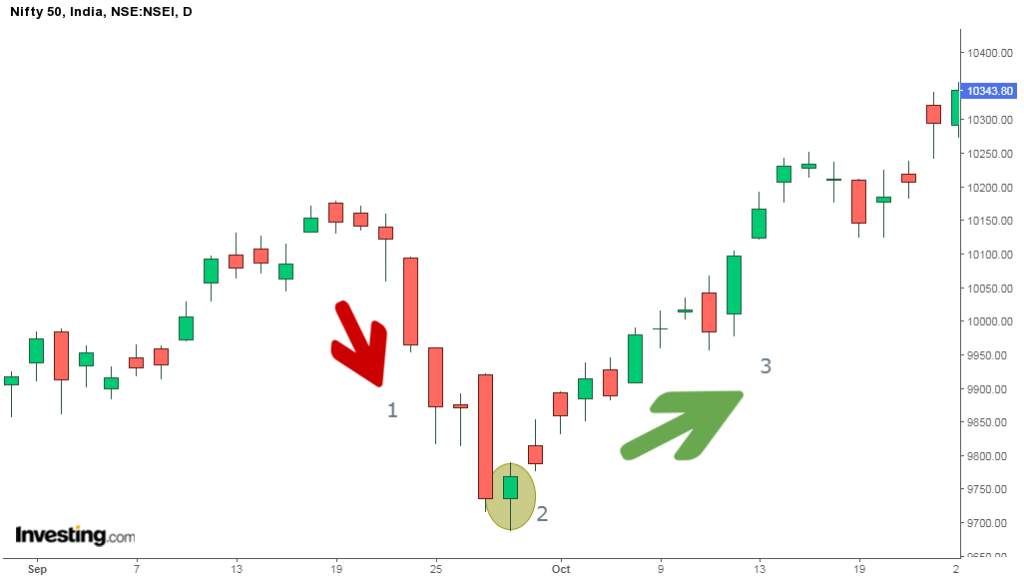
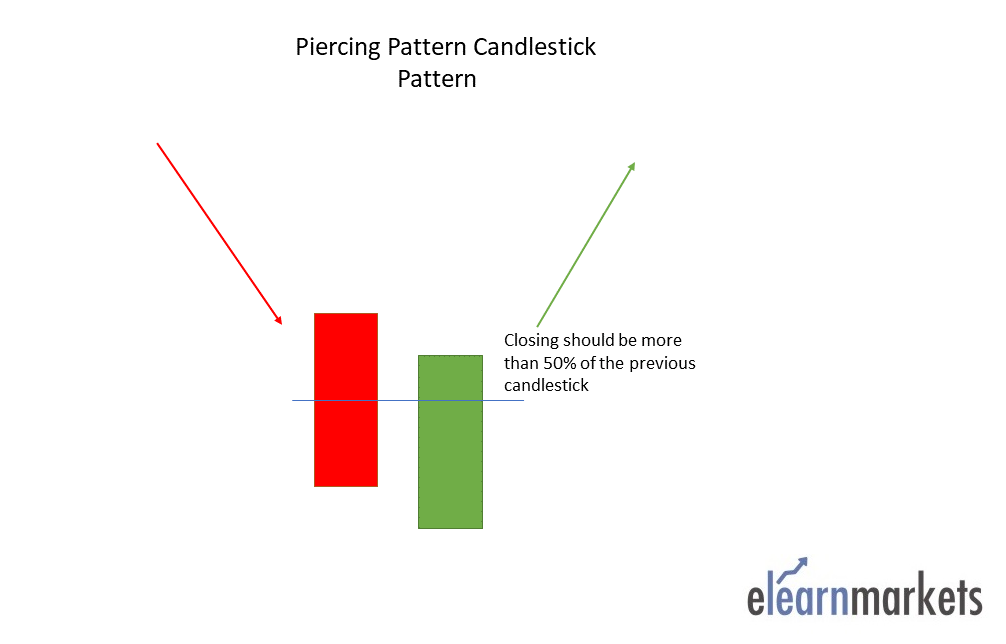
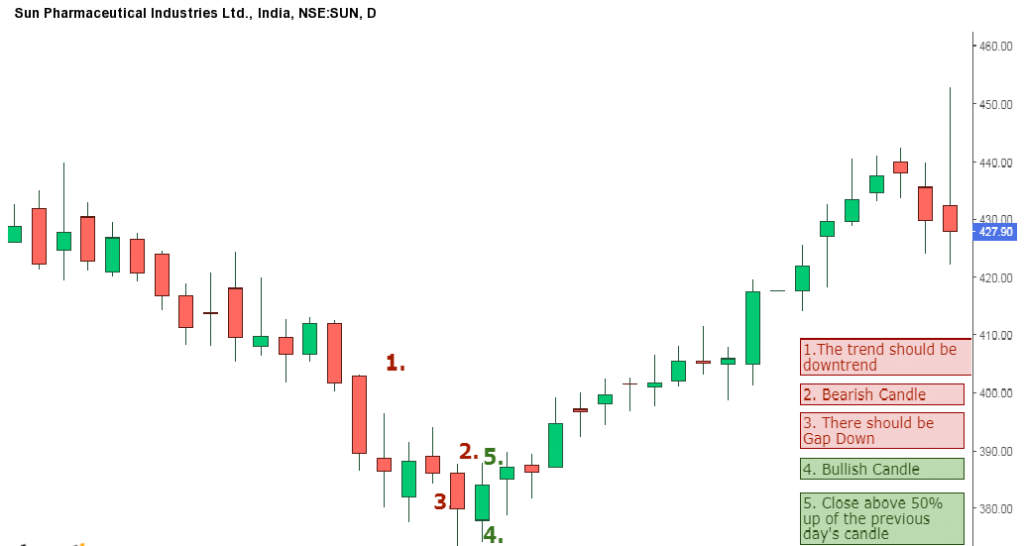
2. Piercing Pattern:
Piercing pattern is a multiple candlestick chart pattern formed after a downtrend indicating a bullish reversal.
Two candles form it, the first candle being a bearish candle which indicates the continuation of the downtrend.
The second candle is a bullish candle which opens the gap down but closes more than 50% of the real body of the previous candle, which shows that the bulls are back in the market and a bullish reversal is going to take place.
Traders can enter a long position if the next day a bullish candle is formed and can place a stop-loss at the low of the second candle.
Below is an example of a Piercing Candlestick Pattern:
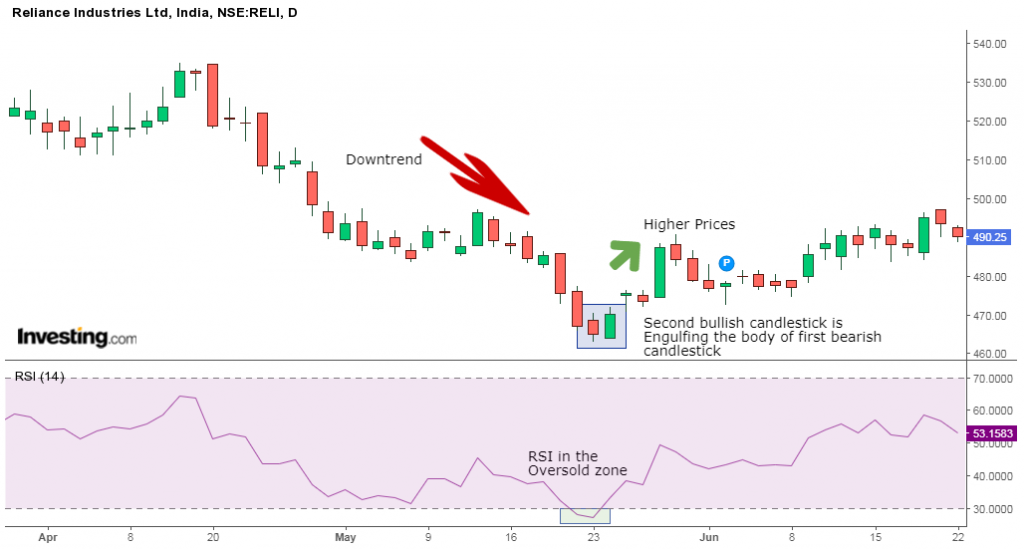
3. Bullish Engulfing:
Bullish Engulfing is a multiple candlestick chart pattern that is formed after a downtrend indicating a bullish reversal.
It is formed by two candles, the second candlestick engulfing the first candlestick. The first candle is a bearish candle that indicates the continuation of the downtrend.
The second candlestick is a long bullish candle that completely engulfs the first candle and shows that the bulls are back in the market.
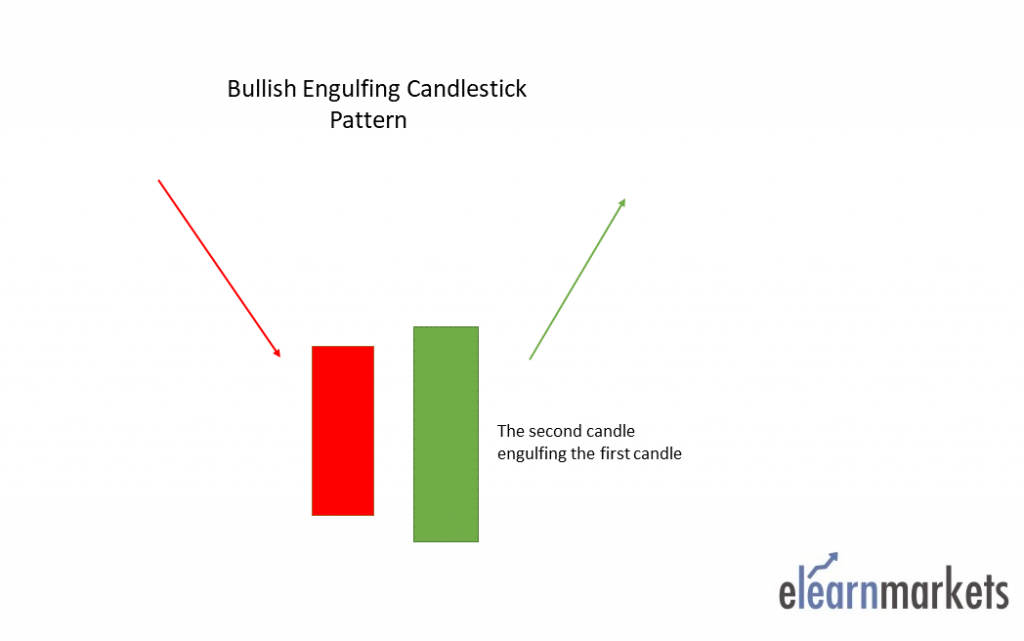
Traders can enter a long position if next day a bullish candle is formed and can place a stop-loss at the low of the second candle.
Below is an example of Bullish Engulfing Candlestick Pattern:
4. The Morning Star:
The Morning Star is a multiple candlestick chart pattern which is formed after a downtrend indicating a bullish reversal.
It is made of 3 candlesticks, the first being a bearish candle, the second a Doji and the third being a bullish candle.
The first candle shows the continuation of the downtrend. The second candle being a doji indicates indecision in the market. The third bullish candle shows that the bulls are back in the market and reversal will take place.
The second candle should be completely out of the real bodies of the first and third candles.
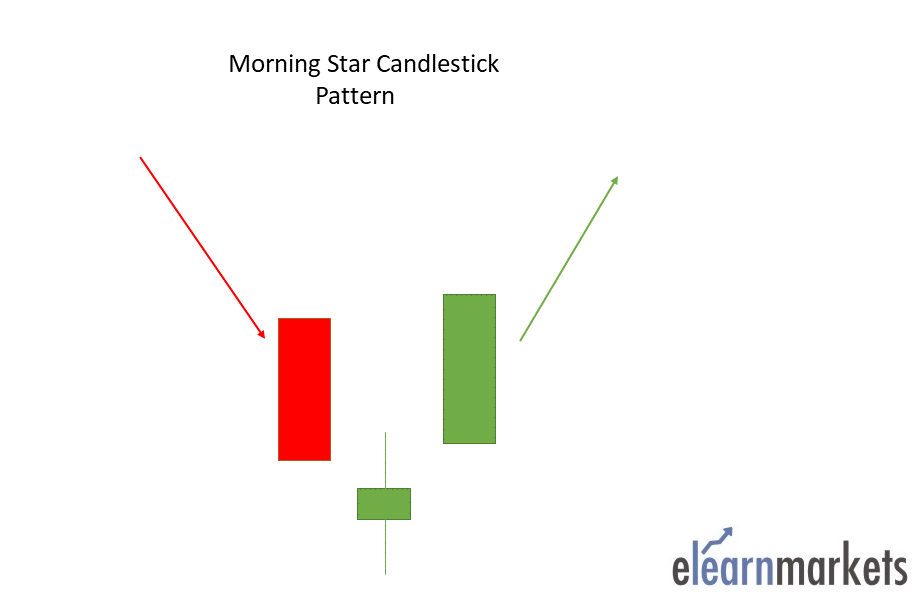
Traders can enter a long position if the next day a bullish candle is formed and can place a stop-loss at the low of the second candle.
Below is an example of Morning Star Candlestick Charts Pattern:
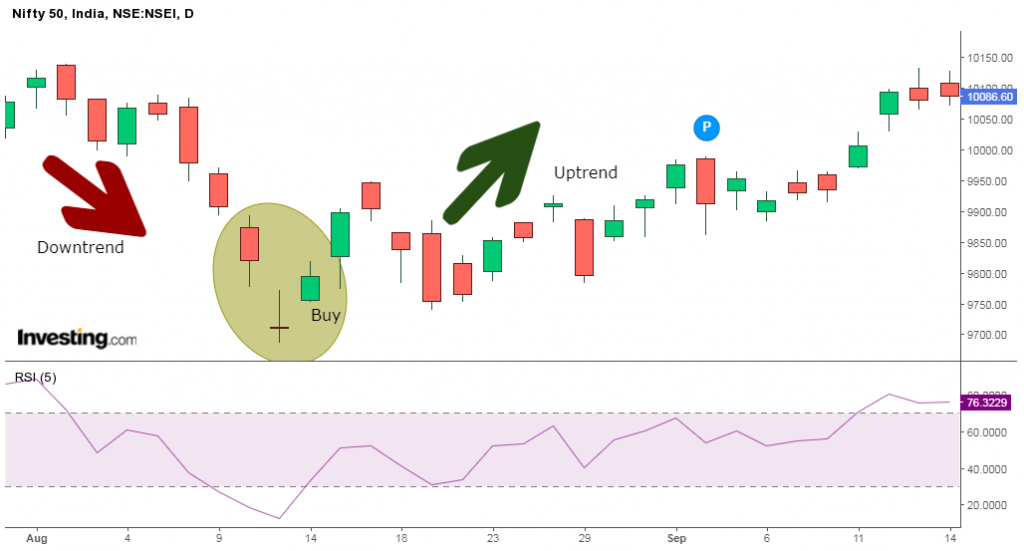
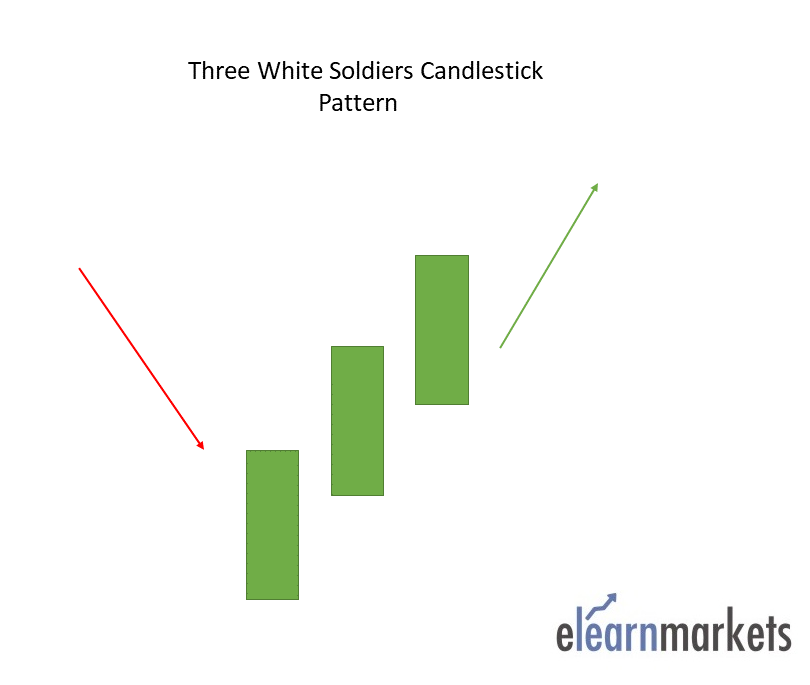
5. Three White Soldiers:
The Three White Soldiers is a multiple candlestick pattern that is formed after a downtrend indicating a bullish reversal.
These candlestick charts are made of three long bullish bodies which do not have long shadows and are open within the real body of the previous candle in the pattern.
6. White Marubozu:
The White Marubozu is a single candlestick pattern that is formed after a downtrend indicating a bullish reversal.
This candlestick has a long bullish body with no upper or lower shadows which shows that the bulls are exerting buying pressure and the markets may turn bullish.
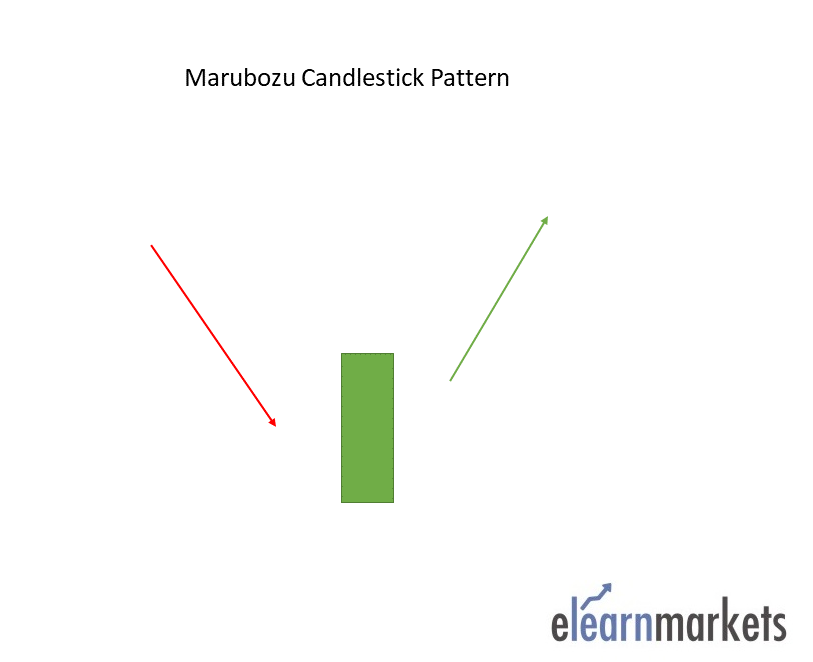
At the formation of this candle, the sellers should be caution and close their shorting position.
7. Three Inside Up:
The Three Inside Up is multiple candlestick pattern which is formed after a downtrend indicating bullish reversal.
It consists of three candlesticks, the first being a long bearish candle, the second candlestick being a small bullish candle which should be in the range the first candlestick.
The third candlestick should be a long bullish candlestick confirming the bullish reversal.

The relationship of the first and second candlestick should be of the bullish harami candlestick pattern.
Traders can take a long position after the completion of this candlestick pattern.
8. Bullish Harami:
The Bullish Harami is multiple candlestick chart pattern which is formed after a downtrend indicating bullish reversal.
It consists of two candlestick charts, the first candlestick being a tall bearish candle and second being a small bullish candle which should be in the range of the first candlestick.
The first bearish candle shows the continuation of the bearish trend and the second candle shows that the bulls are back in the market.
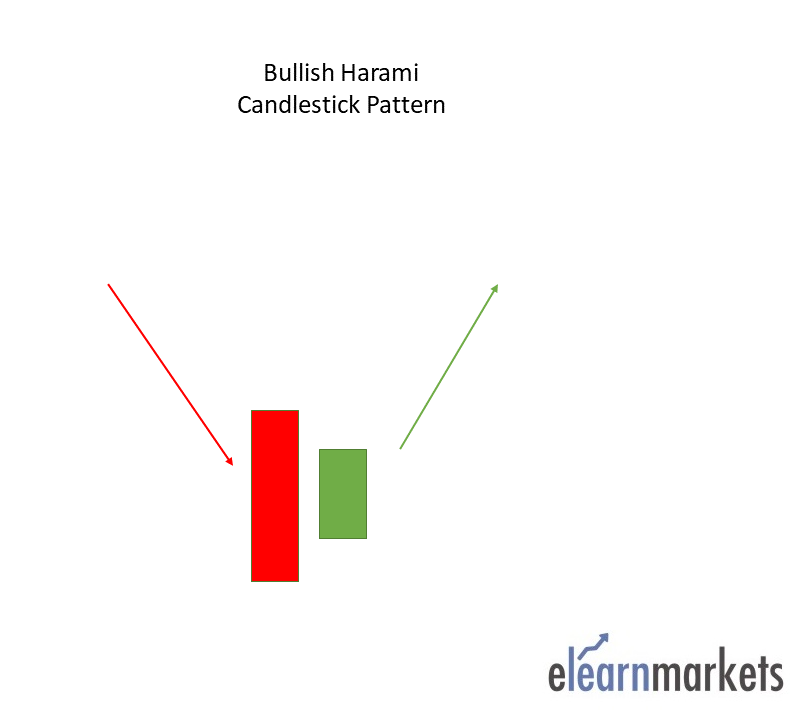
Traders can take a long position after the completion of this candlestick pattern.
9. Tweezer Bottom:
The Tweezer Bottom candlestick pattern is a bullish reversal candlestick pattern that is formed at the end of the downtrend.
It consists of two candlesticks, the first one being bearish and the second one being bullish candlestick.
Both the candlesticks make almost or the same low.When the Tweezer Bottom candlestick pattern is formed the prior trend is a downtrend.
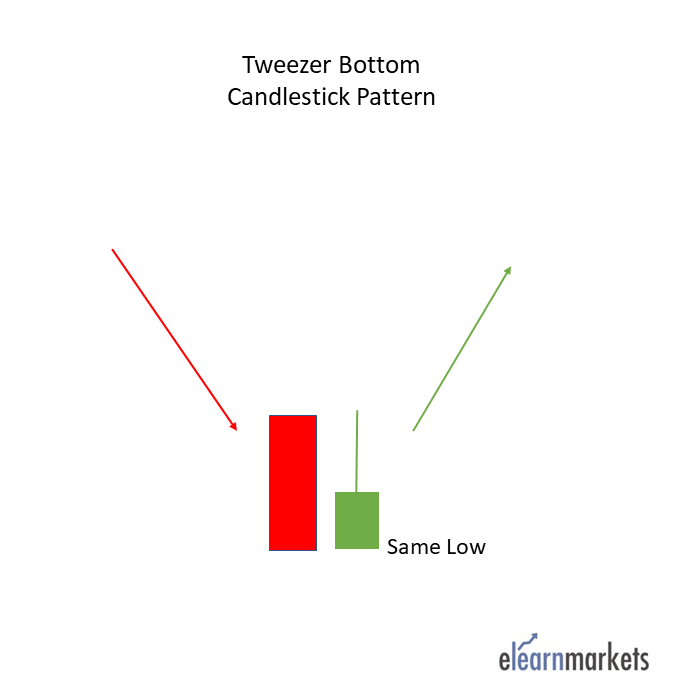
A bearish tweezer candlestick is formed which looks like the continuation of the ongoing downtrend. On the next day, the second day’s bullish candle’s low indicates a support level.
The bottom-most candles with almost the same low indicate the strength of the support and also signal that the downtrend may get reversed to form an uptrend. Due to this the bulls step into action and move the price upwards.
This bullish reversal is confirmed the next day when the bullish candle is formed.
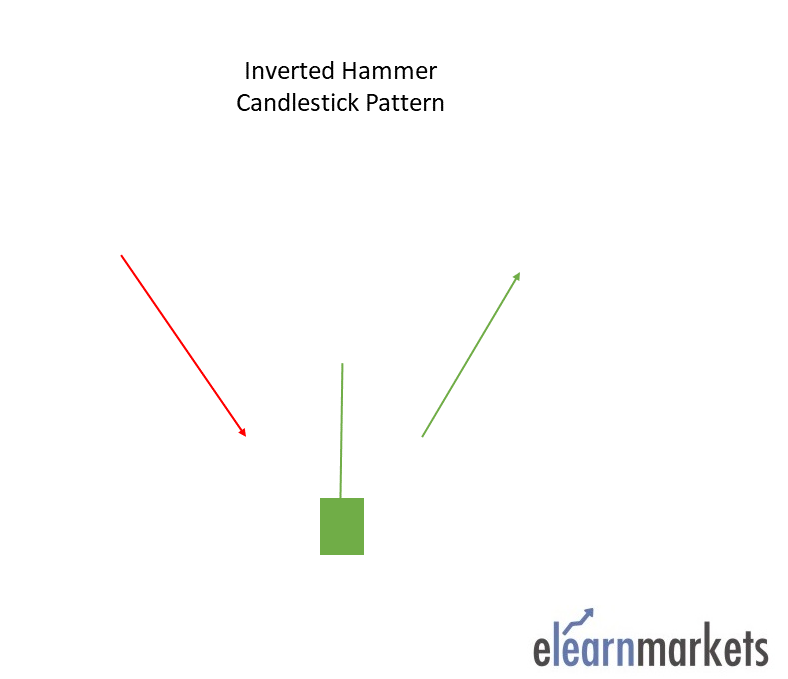
10. Inverted Hammer:
An Inverted Hammer is formed at the end of the downtrend and gives a bullish reversal signal.
In this candlestick, the real body is located at the end and there is a long upper shadow. It is the inverse of the Hammer Candlestick pattern.
This pattern is formed when the opening and closing prices are near to each other and the upper shadow should be more than twice the real body.
11. Three Outside Up:
The Three Outside Up is multiple candlestick pattern which is formed after a downtrend indicating bullish reversal.
It consists of three candlesticks, the first being a short bearish candle, the second candlestick being a large bullish candle which should cover the first candlestick.
The third candlestick should be a long bullish candlestick confirming the bullish reversal.
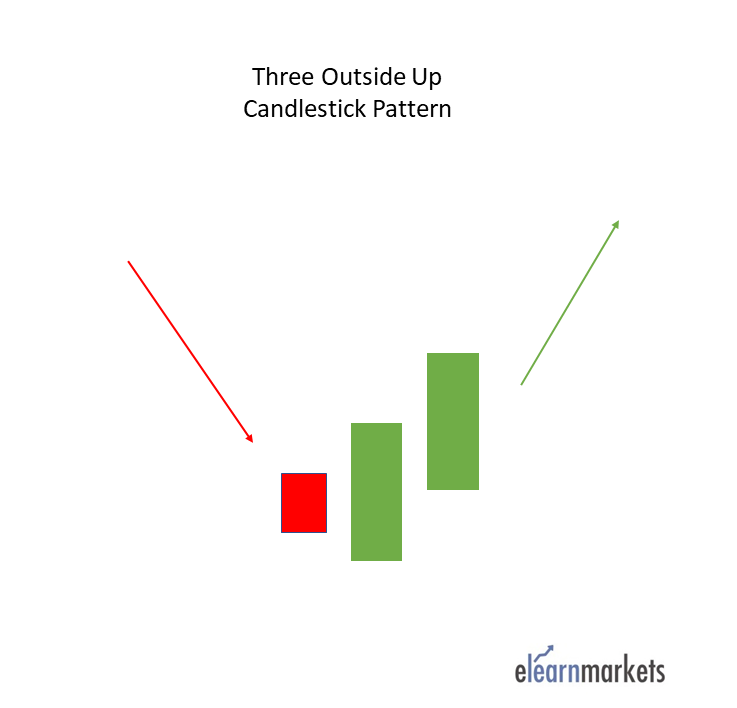
The relationship of the first and second candlestick chart should be of the Bullish Engulfing candlestick pattern.
Traders can take a long position after the completion of this candlestick pattern.
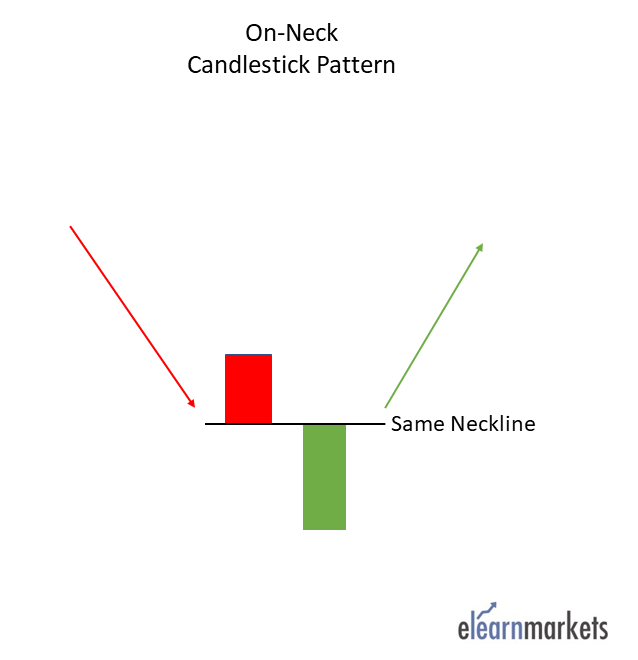
12. On-Neck Pattern:
The on neck pattern occurs after a downtrend when a long real bodied bearish candle is followed by a smaller real bodied bullish candle which gaps down on the open but then closes near the prior candle’s close.
The pattern is called a neckline because the two closing prices are the same or almost the same across the two candles, forming a horizontal neckline.
13. Bullish Counterattack-
The bullish counterattack pattern is a bullish reversal pattern that predicts the upcoming reversal of the current downtrend in the market. This candlestick pattern is a two-bar pattern that appears during a downtrend in the market. A pattern needs to meet the following conditions to be a bullish counterattack pattern.
- There must be a strong downtrend in the market for the formation of the bullish counterattack pattern.
- The first candle must be a long black candle with a real body.
- The second candle must also be a long (ideally, equal in size to the first candle) but a white candle with a real body. The second candle must close near the close of the first candle.
Bearish Candlestick Pattern:
Bearish Reversal candlestick patterns indicate that the ongoing uptrend is going to reverse to a downtrend.
Thus, the traders should be cautious about their long positions when the bearish reversal candlestick patterns are formed.
Below are the different types of bearish reversal candlestick chart patterns:
14. Hanging man:
Hanging Man is a single candlestick pattern which is formed at the end of an uptrend and signals bearish reversal.
The real body of this candle is small and is located at the top with a lower shadow which should be more than the twice of the real body. This candlestick pattern has no or little upper shadow.
The psychology behind this candle formation is that the prices opened and seller pushed down the prices.
Suddenly the buyers came into the market and pushed the prices up but were unsuccessful in doing so as the prices closed below the opening price.
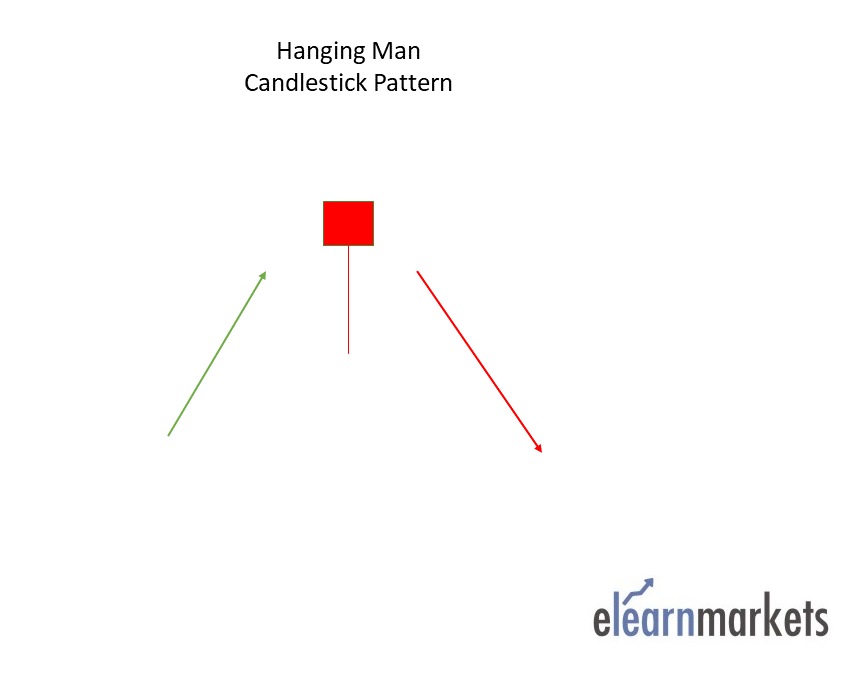
This resulted in the formation of bearish pattern and signifies that seller are back in the market and uptrend may end.
Traders can enter a short position if next day a bearish candle is formed and can place a stop-loss at the high of Hanging Man.
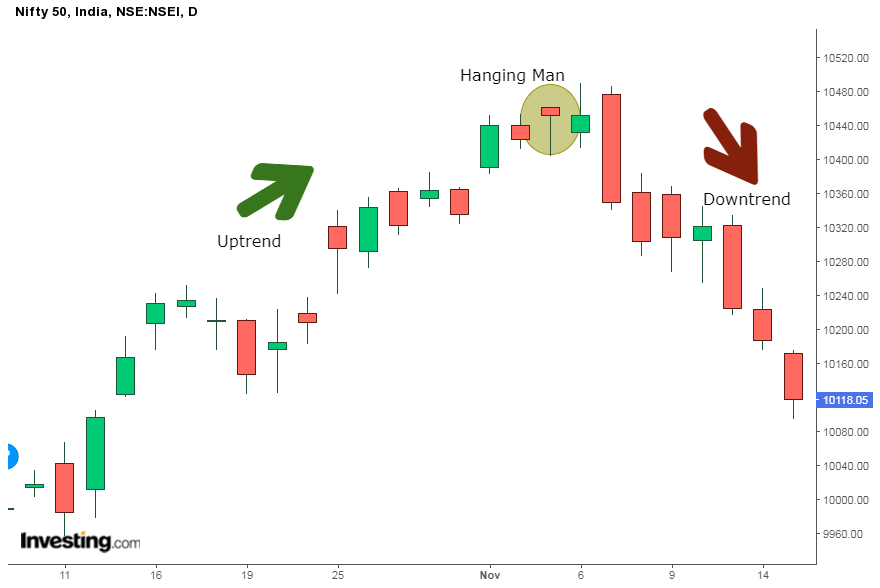
Below is an example of Hanging Man Candlestick Pattern:
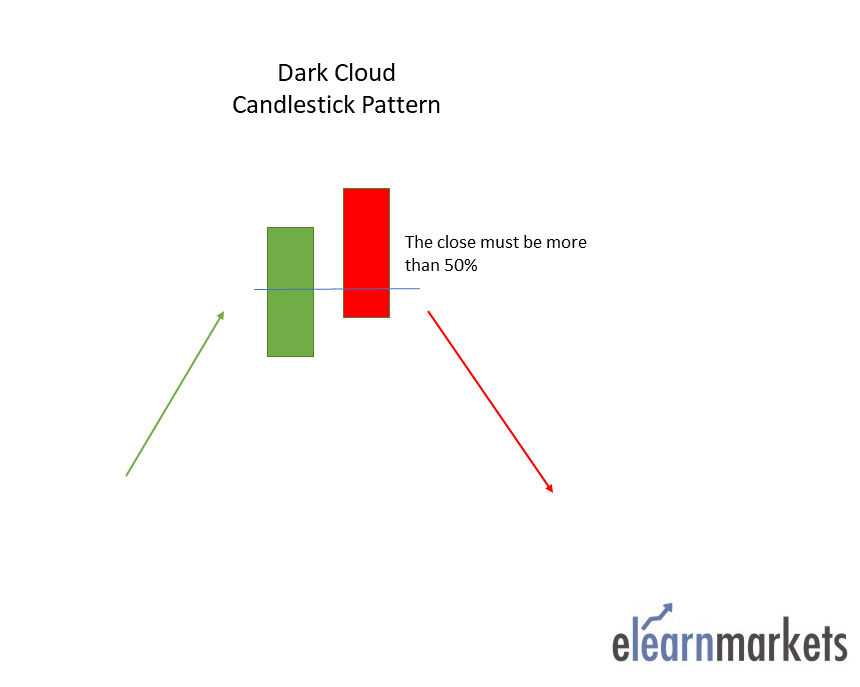
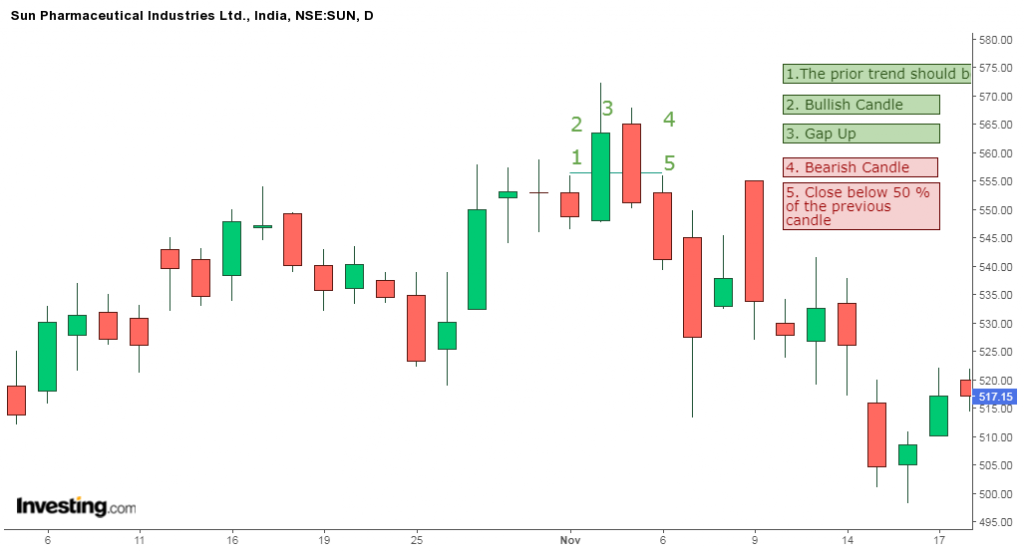
15. Dark cloud cover:
Dark Cloud Cover is multiple candlestick pattern which is formed after the uptrend indicating bearish reversal.
It is formed by two candles, the first candle being a bullish candle which indicates the continuation of the uptrend.
The second candle is a bearish candle which opens gap up but closes more than 50% of the real body of the previous candle which shows that the bears are back in the market and bearish reversal is going to take place.
Traders can enter a short position if the next day a bearish candle is formed and can place a stop-loss at the high of the second candle.
Below is an example of a Dark Cloud candlestick pattern:;
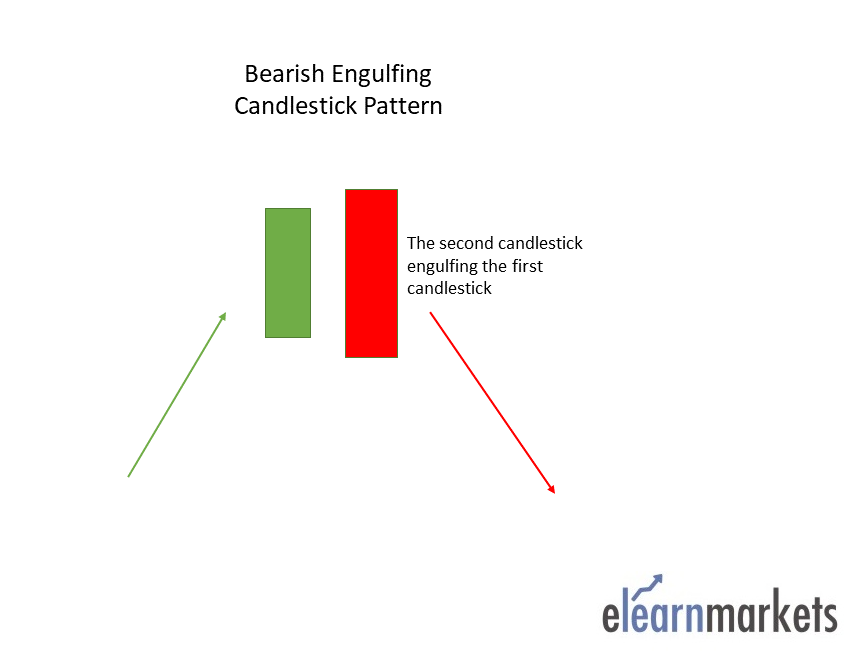
16. Bearish Engulfing:
Bearish Engulfing is a multiple candlestick pattern that is formed after an uptrend indicating a bearish reversal.
It is formed by two candles, the second candlestick engulfing the first candlestick. The first candle being a bullish candle indicates the continuation of the uptrend.
The second candlestick chart is a long bearish candle that completely engulfs the first candle and shows that the bears are back in the market.
Traders can enter a short position if next day a bearish candle is formed and can place a stop-loss at the high of the second candle.
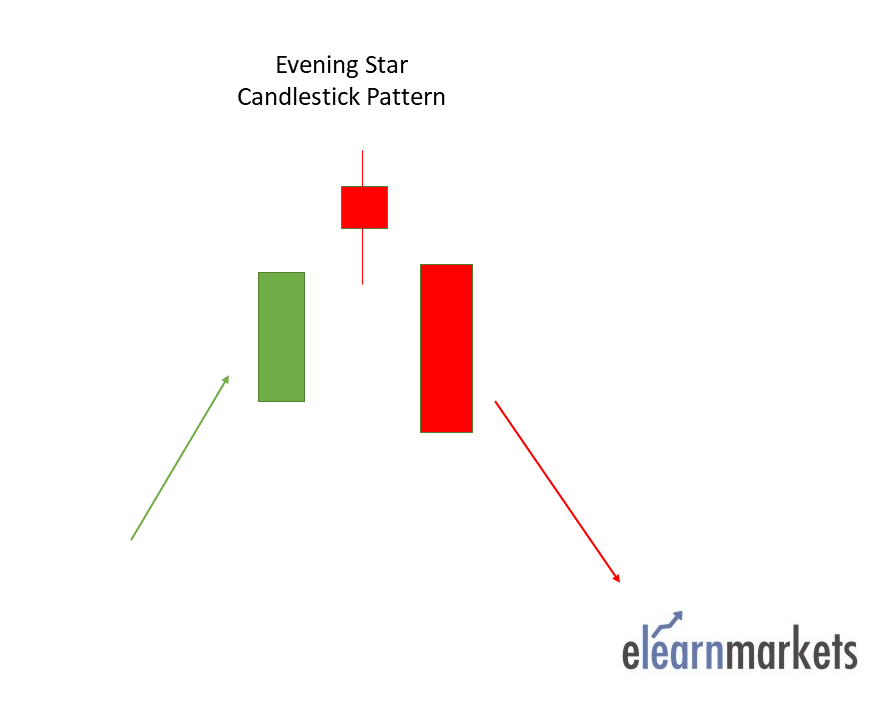
17. The Evening Star:
The Evening Star is multiple candlestick pattern which is formed after the uptrend indicating bearish reversal.
It is made of 3 candlesticks, first being a bullish candle, second a doji and third being a bearish candle.
The first candle shows the continuation of the uptrend, the second candle being a doji indicates indecision in the market, and the third bearish candle shows that the bears are back in the market and reversal is going to take place.
The second candle should be completely out of the real bodies of first and third candle.
Traders can enter a long position if next day a bearish candle is formed and can place a stop-loss at the high of the second candle.
Below is an example of the Evening Star Candlestick Pattern:

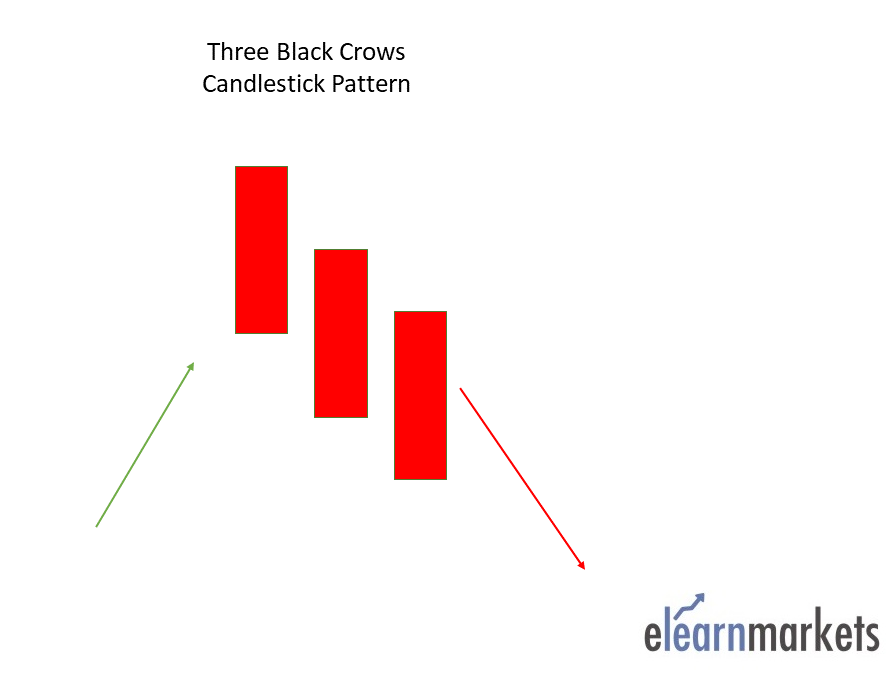
18. Three Black Crows:
The Three Black Crows is multiple candlestick pattern which is formed after an uptrend indicating bearish reversal.
These candlesticks are made of three long bearish bodies which do not have long shadows and open within the real body of the previous candle in the pattern.
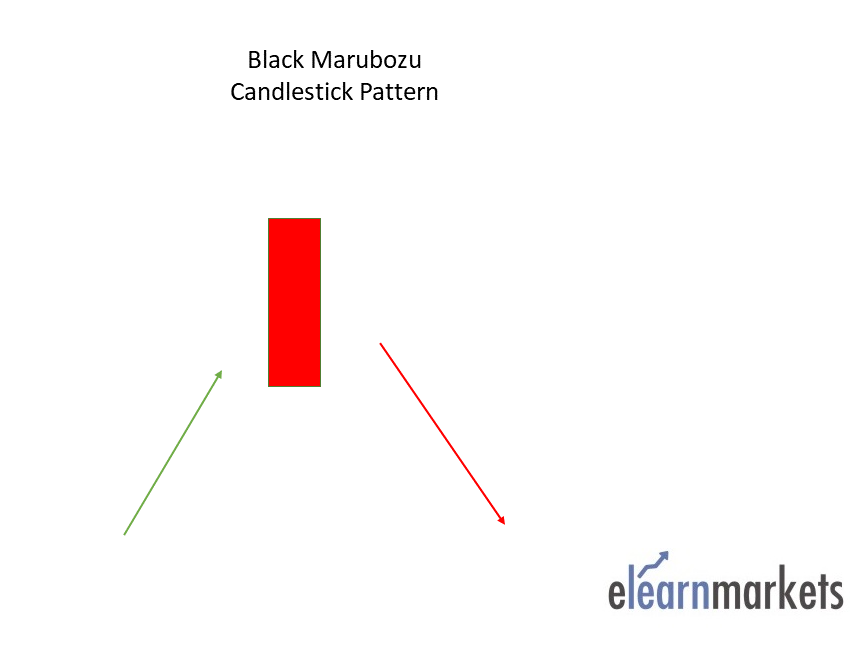
19. Black Marubozu:
The Black Marubozu is a single candlestick pattern which is formed after an uptrend indicating bearish reversal.
This candlestick chart has a long bearish body with no upper or lower shadows which shows that the bears are exerting selling pressure and the markets may turn bearish.
At the formation of this candle, the buyers should be caution and close their buying position.
20. Three Inside Down:
The Three Inside Down is multiple candlestick pattern which is formed after an uptrend indicating bearish reversal.
It consists of three candlesticks, the first being a long bullish candle, the second candlestick being a small bearish which should be in the range the first candlestick.
The third candlestick chart should be a long bearish candlestick confirming the bearish reversal.
The relationship of the first and second candlestick should be of the bearish Harami candlestick pattern.
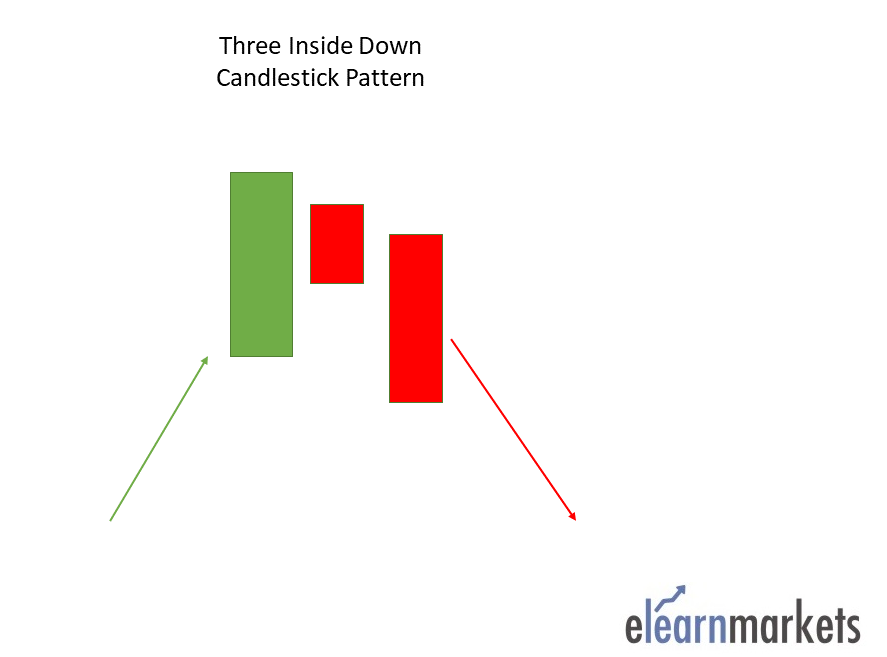
Traders can take a short position after the completion of this candlestick pattern.
21. Bearish Harami:
The Bearish Harami is multiple candlestick pattern which is formed after the uptrend indicating bearish reversal.
It consists of two candlesticks, the first candlestick being a tall bullish candle and second being a small bearish candle which should be in the range of the first candlestick chart.
The first bullish candle shows the continuation of the bullish trend and the second candle shows that the bears are back in the market.
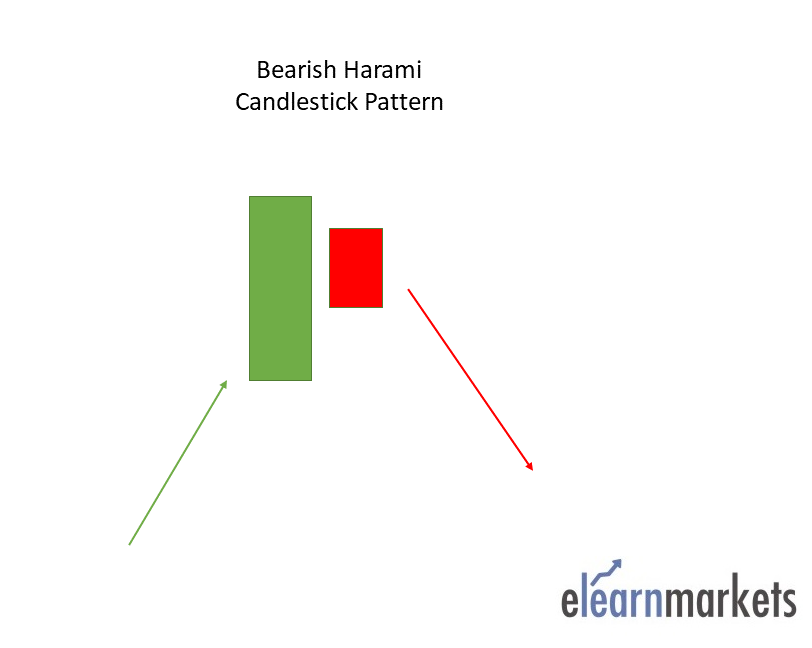
Traders can take a short position after the completion of this candlestick pattern.
22. Shooting Star:
Shooting Star is formed at the end of the uptrend and gives bearish reversal signal.
In this candlestick chart the real body is located at the end and there is long upper shadow. It is the inverse of the Hanging Man Candlestick pattern.
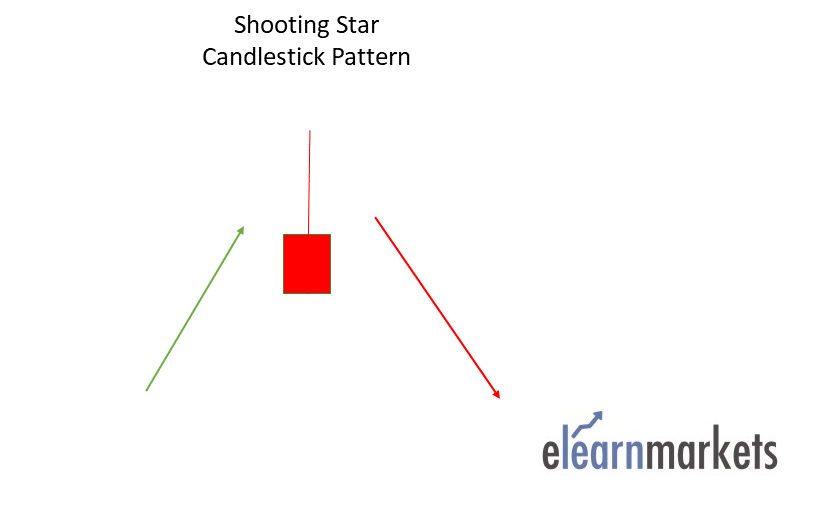
This pattern is formed when the opening and closing prices are near to each other and the upper shadow should be more than the twice of the real body.
23. Tweezer Top:
The Tweezer Top pattern is a bearish reversal candlestick pattern that is formed at the end of an uptrend.
It consists of two candlesticks, the first one being bullish and the second one being bearish candlestick. Both the tweezer candlestick make almost or the same high.
When the Tweezer Top candlestick pattern is formed the prior trend is an uptrend. A bullish candlestick is formed which looks like the continuation of the ongoing uptrend.
On the next day, the high of the second day’s bearish candle’s high indicates a resistance level. Bulls seem to raise the price upward, but now they are not willing to buy at higher prices.
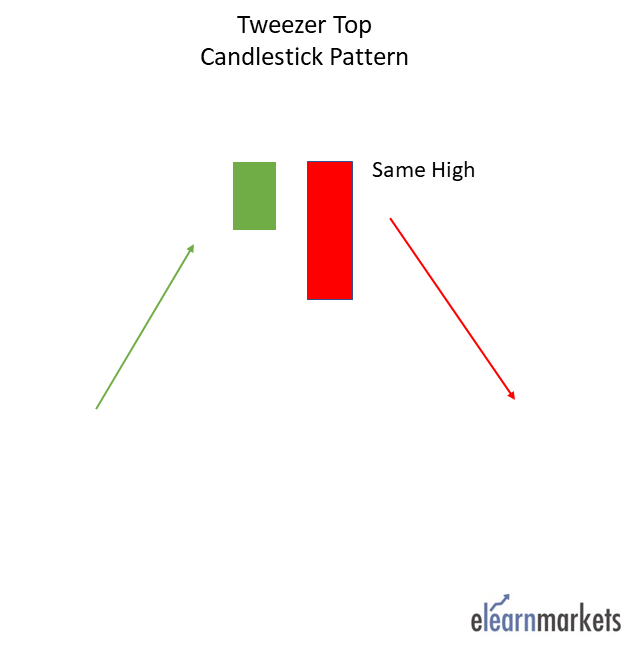
The top-most candles with almost the same high indicate the strength of the resistance and also signal that the uptrend may get reversed to form a downtrend. This bearish reversal is confirmed on the next day when the bearish candle is formed.
24. Three Outside Down:
The Three Outside Down is multiple candlestick pattern which is formed after an uptrend indicating bearish reversal.
It consists of three candlesticks, the first being a short bullish candle, the second candlestick being a large bearish candle which should cover the first candlestick.
The third candlestick should be a long bearish candlestick confirming the bearish reversal.
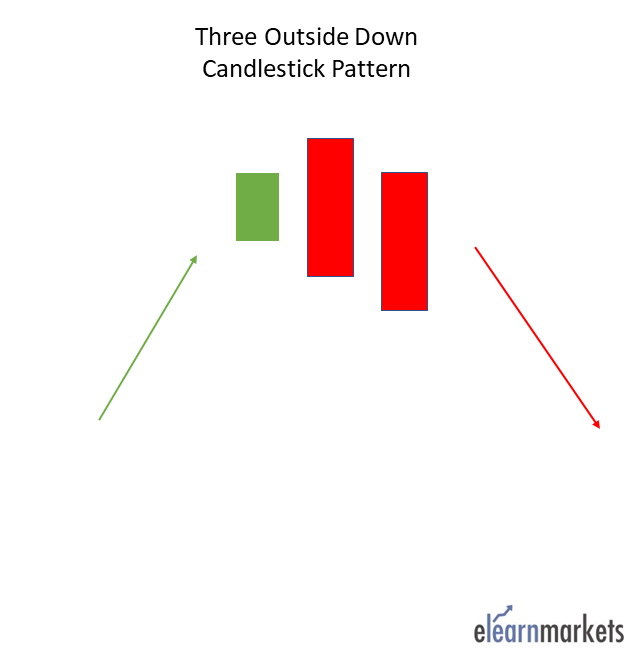
The relationship of the first and second candlestick should be of the Bearish Engulfing candlestick pattern.
Traders can take a short position after the completion of this candlestick pattern.
25. Bearish Counterattack–
The bearish counterattack candlestick pattern is a bearish reversal pattern that appears during an uptrend in the market. It predicts that the current uptrend in the market will make and the new downtrend will take over the market.
Continuation Candlestick Patterns:
26. Doji:
Doji pattern is a candlestick pattern of indecision which is formed when the opening and closing prices are almost equal.
It is formed when both the bulls and bears are fighting to control prices but nobody succeeds in gaining full control of the prices.
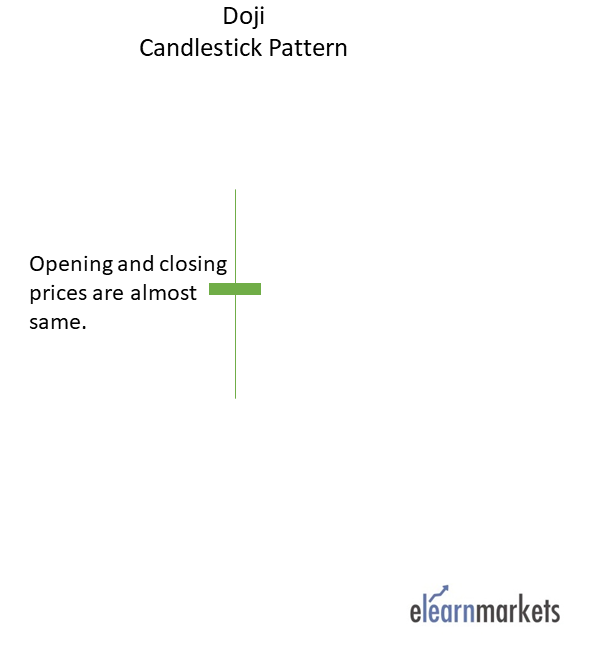
The candlestick pattern looks like a cross with very small real body and long shadows.
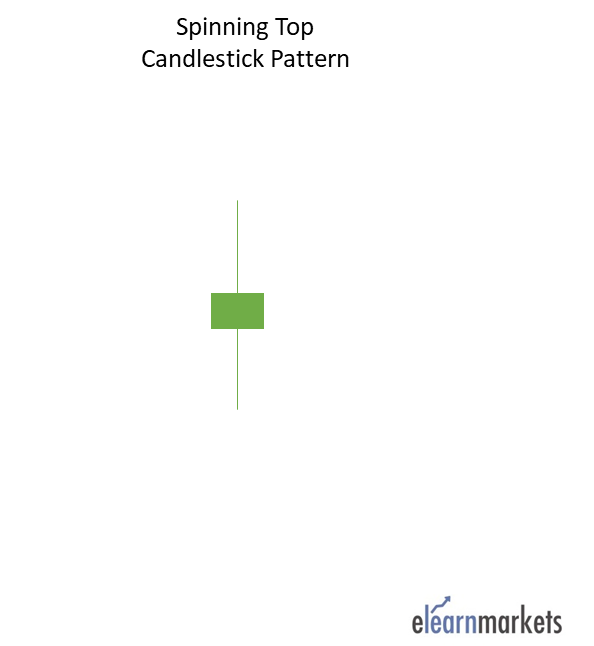
27. Spinning Top:
The spinning top candlestick pattern is same as the Doji indicating indecision in the market.
The only difference between spinning top and doji is in their formation, the real body of the spinning is larger as compared to Doji.
28. Falling Three Methods:
The “falling three methods” is a bearish, five candle continuation pattern which signals an interruption, but not a reversal, of the ongoing downtrend.
The candlestick pattern is made of two long candlestick charts in the direction of the trend i.e downtrend at the beginning and end, with three shorter counter-trend candlesticks in the middle.
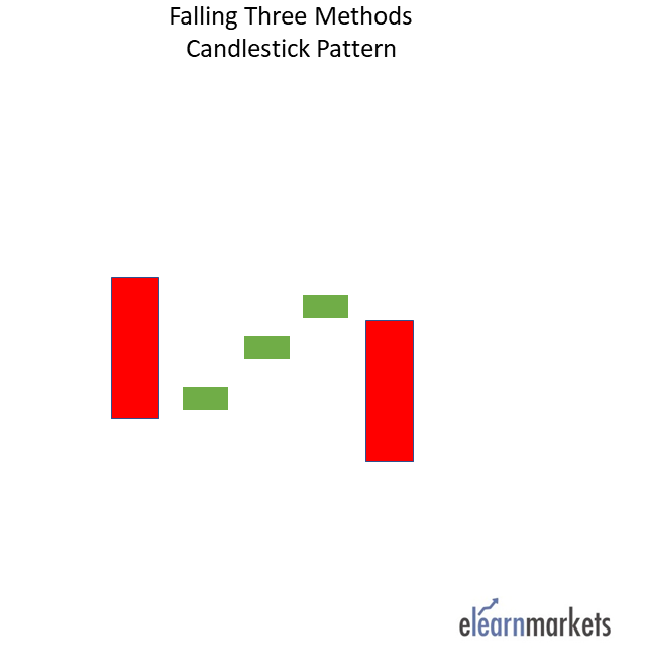
The candlestick pattern is important as it shows traders that the bulls still do not have enough power to reverse the trend.
29. Rising Three Methods:
The “rising three methods” is a bullish, five candle continuation pattern which signals an interruption, but not a reversal, of the ongoing uptrend.
The candlestick pattern is made of two long candlesticks in the direction of the trend i.e uptrend in this case. at the beginning and end, with three shorter counter-trend candlesticks in the middle.
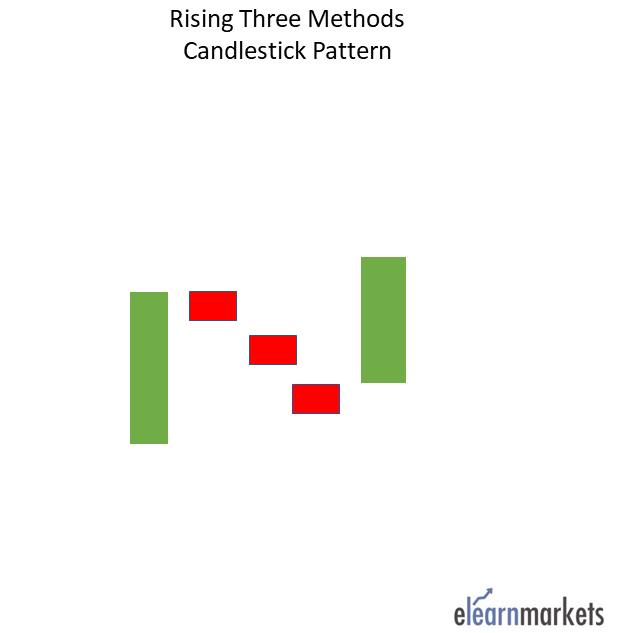
The candlestick pattern is important as it shows traders that the bears still do not have enough power to reverse the trend.
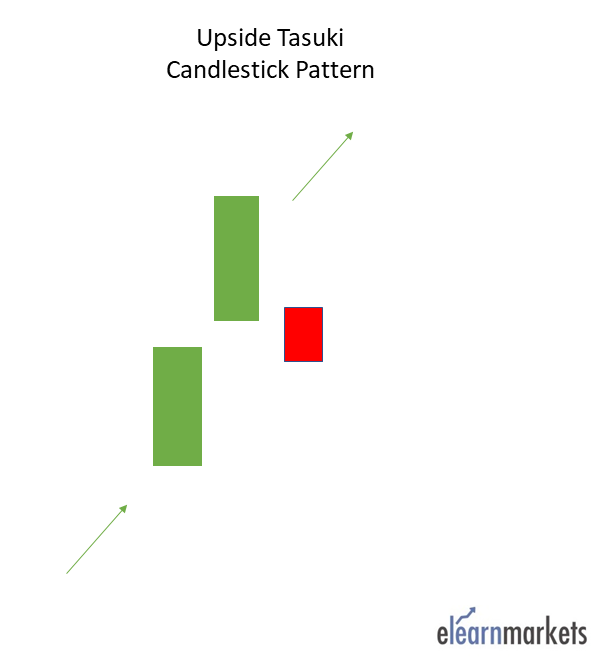
30. Upside Tasuki Gap:
It is a bullish continuation candlestick pattern which is formed in an ongoing uptrend.
This candlestick pattern consists of three candles, the first candlestick is a long-bodied bullish candlestick, and the second candlestick is also a bullish candlestick chart formed after a gap up.
The third candlestick is a bearish candle that closes in the gap formed between these first two bullish candles.
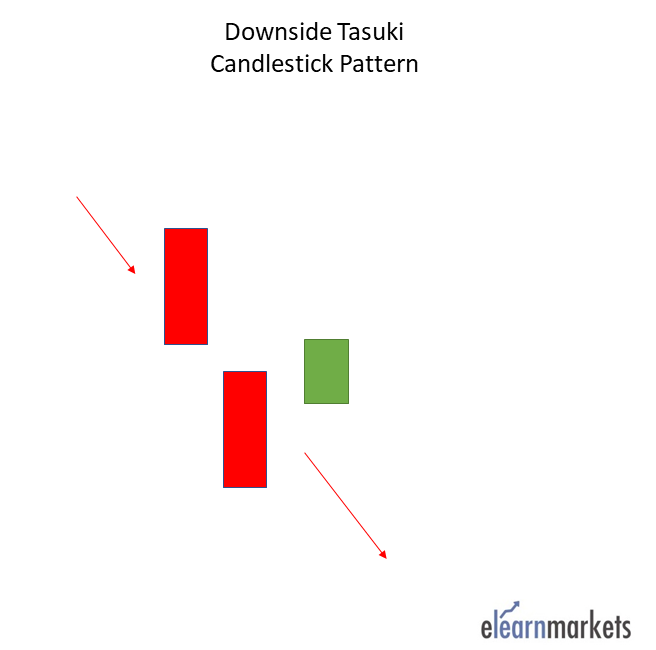
31. Downside Tasuki Gap:
It is a bearish continuation candlestick pattern which is formed in an ongoing downtrend.
This candlestick pattern consists of three candles, the first candlestick is a long-bodied bearish candlestick, and the second candlestick is also a bearish candlestick formed after a gap down.
The third candlestick is a bullish candle that closes in the gap formed between these first two bearish candles.
32. Mat-Hold-
A mat hold pattern is a candlestick formation indicating the continuation of a prior trend.
There can be either bearish or bullish mat hold patterns. A bullish pattern begins with a large bullish candle followed by a gap higher and three smaller candles which move lower.
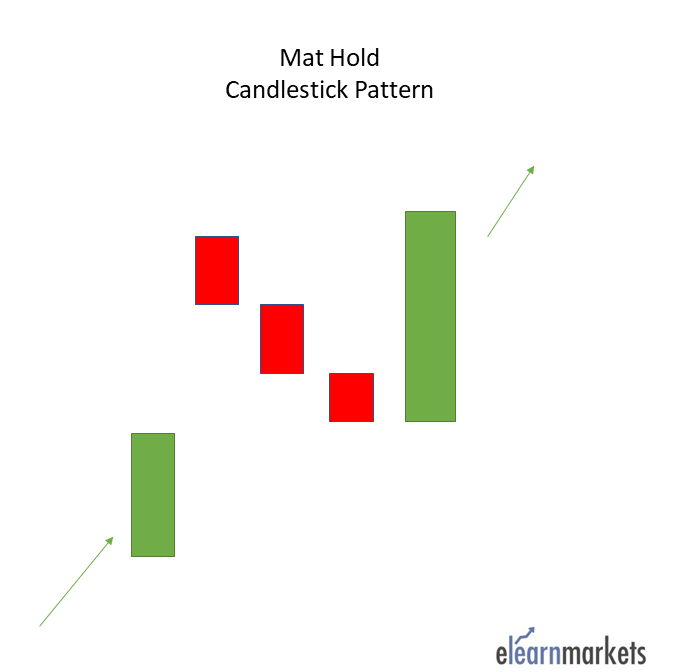
These candles must stay above the low of the first candle. The fifth candle is a large candle that moves to the upside again. The pattern occurs within an overall uptrend.
33. Rising Window-
The rising window is a candlestick pattern consisting of two bullish candlesticks with a gap between them. The gap is a space between the high and low of two candlesticks that occurs due to high trading volatility. It is a trend continuation candlestick pattern indicating strong strength of buyers in the market.
34. Falling Window-
The falling window is a candlestick pattern that consists of two bearish candlesticks with a gap between them. The gap is a space between the high and low of two candlesticks. it occurs due to high trading volatility. It is a trend continuation candlestick pattern and it is an indication of the strong strength of sellers in the market.
35. High Wave-
The high wave candlestick pattern is an indecision pattern that shows the market is neither bullish nor bearish. It mostly occurs at support and resistance levels. This is where bears and bulls battle each other in the effort of trying to push the price in a given direction. Candlesticks depict the pattern with long lower shadows and long upper wicks. Likewise, they have small bodies. The long wicks signal there was a large amount of price movement during the given period. However, the price ultimately ended up closing near the opening price.
You can also download our Ebook on Technical Analysis which has all candlestick patterns in pdf format.
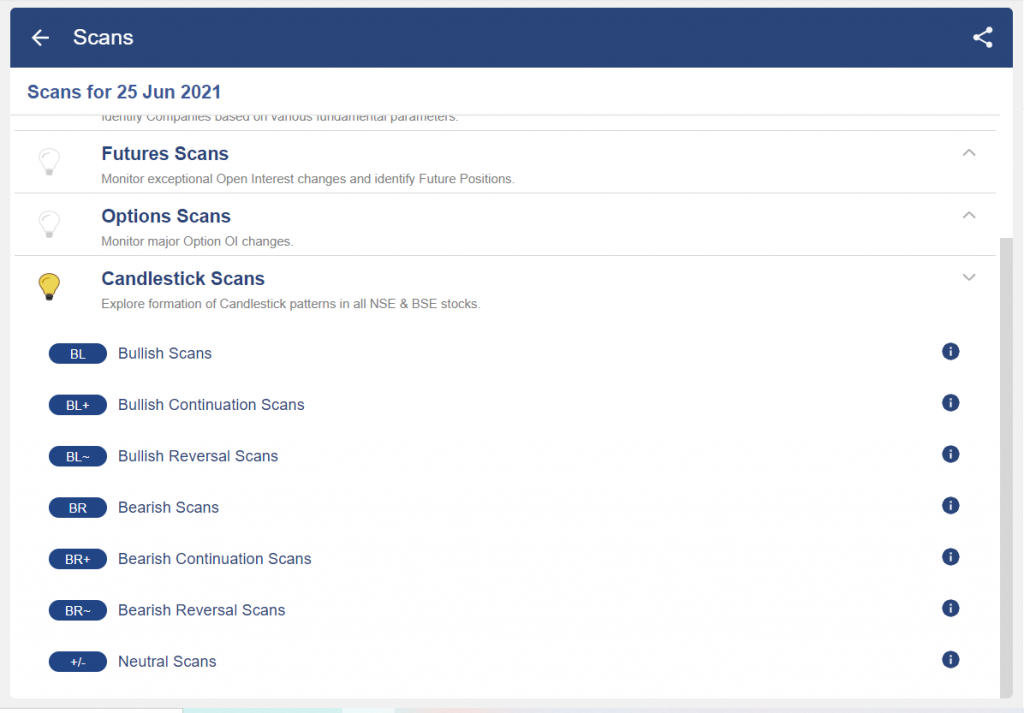
Filter Stocks with Specific Candlestick Chart Patterns using StockEdge:
You can filter out stocks using various candlestick scans available in StockEdge:
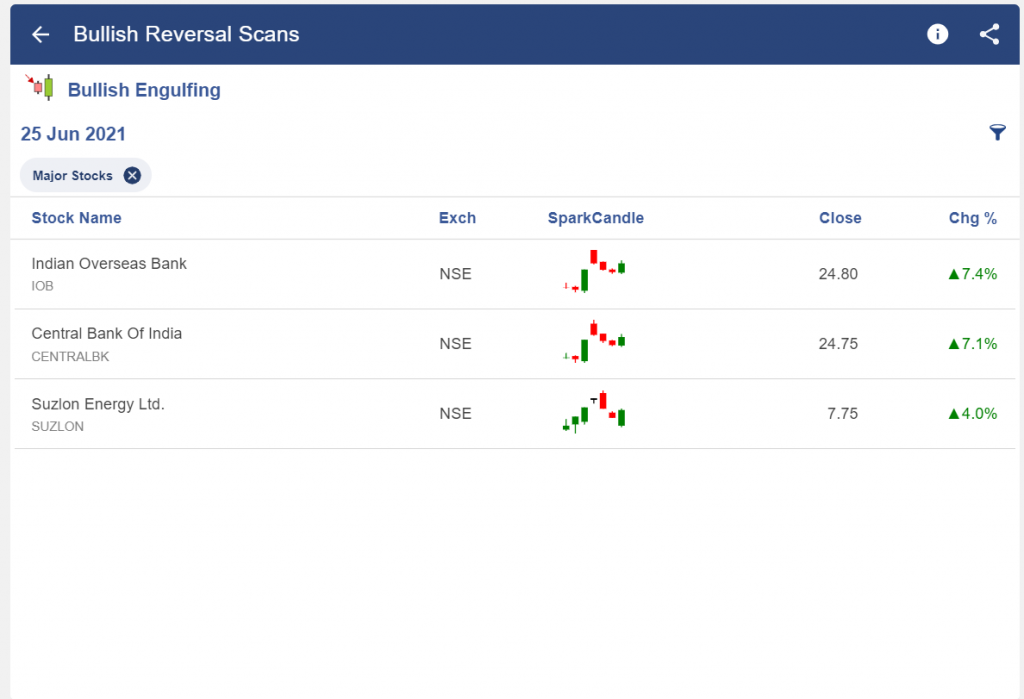
For example below we can see a list of stocks in which Bullish Engulfing pattern was formed:
Short Online Courses on Candlestick Patterns:
Below are some courses on candlestick that will help you in learning about these patterns:
1. Candlestick Made Easy-
As we have discussed above, With the help of the candlestick charts, traders can take trading decisions like when to enter or exit the stock by analysing them in the technical charts.
In this course, Candlestick Made Easy traders will understand various candlestick patterns and how to use them in trading.
2. Candlestick training in Hindi-
If you are interested in learning about different candlestick patterns in Hindi, then you can also check this course, Candlestick training in Hindi.
3. Candlestick Analysis in Tamil–
If you are interested in learning about different candlestick patterns in Tamil, then you can also check this course, Candlestick Analysis in Tamil
4. Master Of Technical Analysis–
You can also learn about other technical tools like indicators, chart patterns, along with the other candlestick patterns in this free module, Master Of Technical Analysis.
Short Online Webinars on Candlestick Patterns:
Below are some webinars on candlestick that will help you in learning about these patterns:
1. Trade better with Candlestick-
In this webinar the trainer, Mr. Piyush Chaudhry will help you in understanding candlesticks, spotting candlestick patterns differentiating between reversal and continuation patterns and understanding when are they reliable and when they are not.
2. Psychology behind Candlestick Pattern –
In this webinar Ms. Jyoti Budhia will help you in understanding the psychology behind the formation of these candlestick patterns.
3. Identifying trading opportunities using candlesticks analysis-
In this webinar the trainer, Mr. Umesh Sharma will help you in Identifying trading opportunities using candlesticks analysis.
4. Trading made easy with Candlesticks in Tamil –
The webinar will cover how to understand and effectively use candlesticks to trade for indices/stocks in Tamil.
Bottomline:
One should remember that the candlestick patterns that we have discussed above should always be used with other technical indicators as sometimes the signals generated by these patterns can be false.
We hope you found this blog informative and use it to its maximum potential in the practical world. Also, show some love by sharing this blog with your family and friends and helping us in our mission of spreading financial literacy.